
Birchcliff Energy (TSX:BIR) Lifted Long Term Production Guidance, Is The Upside Already Priced In?
Birchcliff Energy (TSX:BIR) has raised its longer-term production expectations. This change directly shapes how investors might think about future cash generation and the stock’s current valuation.
The recent guidance upgrade comes on top of a strong run in the share price. Birchcliff Energy has delivered a 19.03% 1 month share price return and 15.49% 3 month share price return, while the 1 year total shareholder return of 14.85% points to positive momentum over a longer stretch.
See how Birchcliff Energy compares with other cash-generating producers by reviewing our hand picked list of 3 high quality undervalued stocks.
After a sharp move on the back of higher long term production guidance, the real tension around Birchcliff Energy is simple. Has the market already paid up for that extra output, or is some upside still on the table as cash flow expectations evolve?
Preferred P/E of 21.1x for Birchcliff Energy: Is it justified?
On simple earnings maths, Birchcliff Energy trades on a P/E of 21.1x, which largely lines up with the Canadian Oil and Gas industry at 21.3x and sits slightly above the peer average of 20.5x.
P/E tells you how much investors are paying today for each dollar of earnings. For an explorer and producer such as Birchcliff Energy, that ratio effectively reflects what the market is willing to pay for its current profitability and the expectation that recent profit trends can be maintained or improved.
Over the past year, earnings growth of 25.1% and higher net profit margins of 13.4% compared with 11.8% previously give some context for why the market might accept a P/E that is a little above the peer average. At the same time, earnings have declined by 38.6% per year over the past 5 years, which pulls against that recent momentum and helps explain why the current multiple sits close to, rather than far above, the wider industry level.
Compared to the broader Canadian Oil and Gas group, Birchcliff Energy looks fairly aligned on valuation, with its 21.1x P/E fractionally below the 21.3x industry average yet a touch higher than the 20.5x peer benchmark. This suggests the market is pricing the stock broadly in line with sector earnings while applying only a modest premium to its immediate peer set.
See what the numbers say about this price — find out in our valuation breakdown.
Result: Price-to-earnings of 21.1x (ABOUT RIGHT)
Still, the Birchcliff Energy story can be knocked off course if commodity prices weaken or if higher planned output requires more capital than investors currently expect.
Find out about the key risks to this Birchcliff Energy narrative.
Another View On Birchcliff Energy’s Value
The SWS DCF model paints a very different picture for Birchcliff Energy. With the share price at CA$7.38 and the future cash flow value estimated at CA$3.51, the stock screens as expensive on this framework, which raises a clear question: Are recent production plans already more than priced in?
Look into how the SWS DCF model arrives at its fair value.
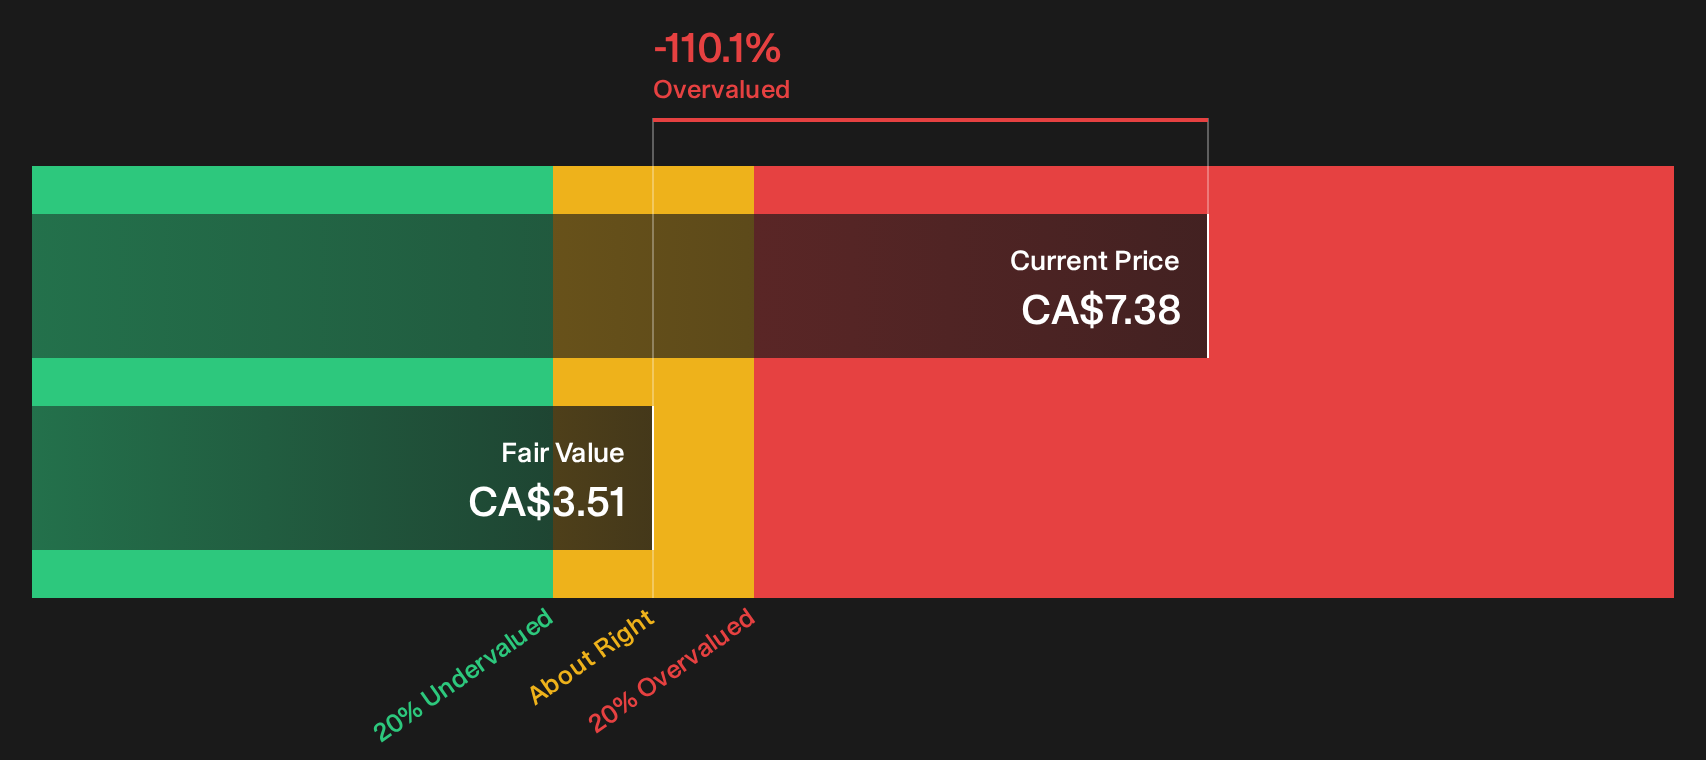
Simply Wall St performs a discounted cash flow (DCF) on every stock in the world every day (check out Birchcliff Energy for example). We show the entire calculation in full. You can track the result in your watchlist or portfolio and be alerted when this changes, or use our stock screener to discover 3 high quality undervalued stocks. If you save a screener we even alert you when new companies match - so you never miss a potential opportunity.
Next Steps
Mixed signals around Birchcliff Energy’s valuation and growth story call for a closer look. Move quickly and weigh the trade off between potential risks and possible upside using the 3 key rewards and 1 important warning sign
Looking for more investment ideas beyond Birchcliff Energy?
Do not stop at Birchcliff Energy. Broaden your watchlist with other opportunities that fit different goals, risk levels and income needs using the Simply Wall St Screener.
- Target potential mispricing by scanning a 3 high quality undervalued stocks that pulls together companies with solid fundamentals trading below their estimated worth.
- Lock in potential income streams through a 3 dividend fortresses focused on businesses offering robust yields that may appeal to payout focused investors.
- Reduce portfolio shocks by hunting in a 7 resilient stocks with low risk scores that highlights resilient businesses with steadier profiles.
Have feedback on this article? Concerned about the content? Get in touch with us directly. Alternatively, email editorial-team@simplywallst.com