
Transurban Group (ASX:TCL) Traffic Rose 3.1%, Is The Stock Still Undervalued?
Traffic update puts Transurban Group in focus
Transurban Group (ASX:TCL) caught investor attention after reporting operating results for the September 2026 quarter, with average daily traffic of 2,576,000 vehicles, a 3.1% increase on the 2,499,000 recorded a year earlier.
That traffic update comes against a mixed price backdrop, with Transurban Group’s share price at A$13.83 after a 30 day share price return of 6.3%, a 90 day share price return that declined 6.6%, and a 3 year total shareholder return of 28.9% that points to steadier longer term momentum.
Scan beyond Transurban Group and review other toll road and infrastructure operators showing resilient usage trends through our curated list of solid balance sheet and fundamentals (12 results).
After a traffic update that landed well and a share price that has already moved over the past month, investors may be wondering whether the current Transurban Group valuation still offers enough potential to justify the risk for new buyers.
Most Popular Narrative: 2.9% Undervalued
On the numbers, the most followed valuation view puts Transurban Group at a fair value of A$14.25 per share versus the recent A$13.83 close, which anchors the current traffic update inside a slightly positive pricing gap.
At A$14.245 per share, Transurban Group (ASX: TCL) appears reasonably valued based on its current cash flow and distribution guidance. Transurban generated free cash of 34.8 cents per share during the first half of FY26 and maintained full-year distribution guidance of 69 cents per share. This represents a forecast cash yield of approximately 4.8% at the assessed price, with the distribution expected to be fully covered by free cash.
See why 4 investors see Transurban Group as 3% undervalued.
Result: Fair Value of A$14.25 (UNDERVALUED)
Still, higher debt costs or weaker traffic trends on key Transurban Group corridors could quickly challenge assumptions about cash coverage and fair value.
Find out about the key risks to this Transurban Group narrative.
Another View: Transurban Group Looks Expensive On Earnings
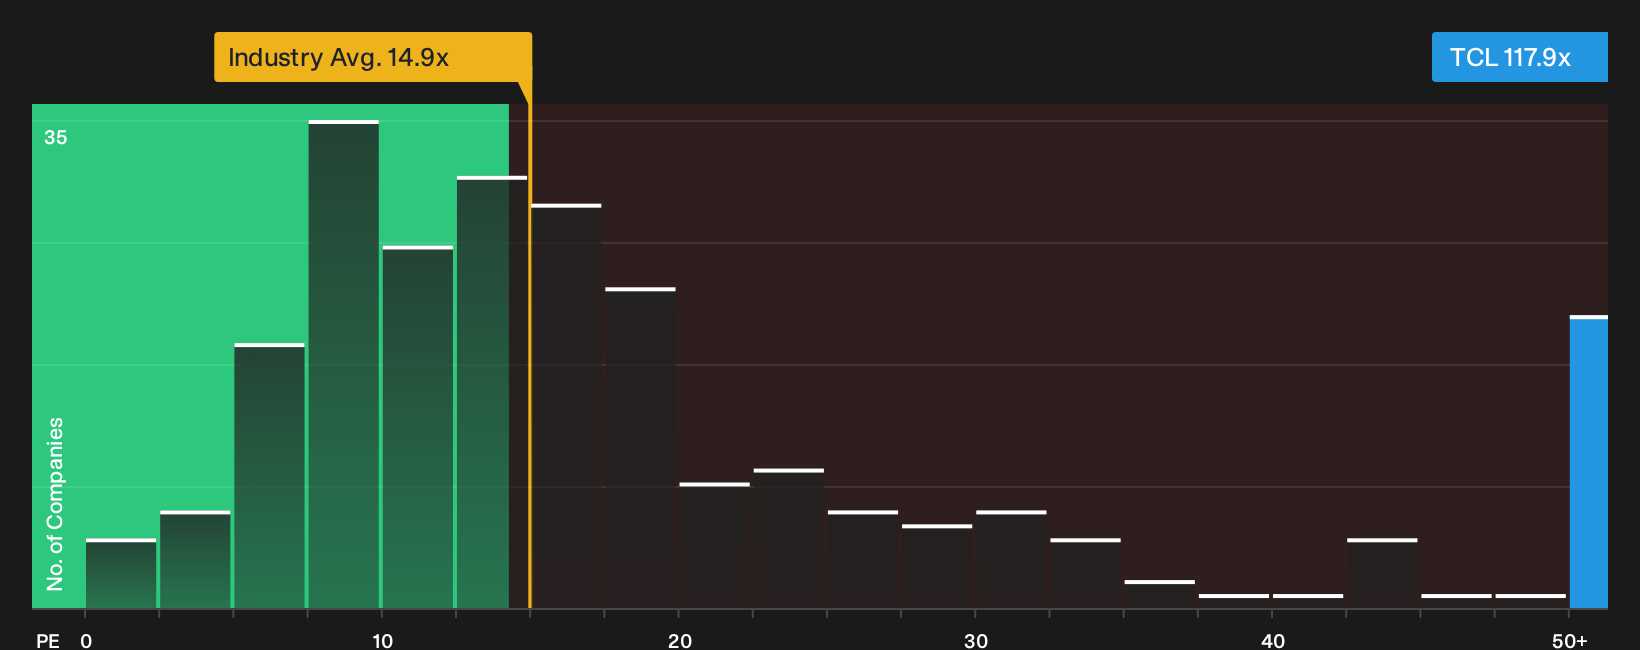
A different lens tells a sharper story. On a P/E basis, Transurban Group trades at 117.9x earnings, while the global infrastructure industry sits at 14.9x and close peers at 16.7x. The fair ratio is 23.6x. That gap loads more valuation risk onto every A$1 you put in. Does the earnings multiple really justify the current traffic and cash profile?
For a closer look at how that earnings-based gap might evolve, check the valuation breakdown, including the fair ratio and peer comparison, through the See what the numbers say about this price — find out in our valuation breakdown..
Next Steps
Mixed signals on Transurban Group can easily pull you in different directions, so check the numbers yourself, weigh the concerns against the positives, and then review the 3 key rewards and 2 important warning signs.
Looking for more investment ideas beyond Transurban Group?
If Transurban Group has sharpened your focus on quality and price, broaden your watchlist now so you are not relying on a single story.
- Target potential mispricing across the market by scanning companies that look attractively valued on quality and fundamentals through the 1 high quality undervalued stocks.
- Lock in the income angle by hunting for businesses with stronger yield profiles and sturdier payout records using the 4 dividend fortresses.
- Prioritise sleep-at-night holdings by zeroing in on resilient balance sheets and robust financials with the 6 resilient stocks with low risk scores.
Have feedback on this article? Concerned about the content? Get in touch with us directly. Alternatively, email editorial-team@simplywallst.com