
APi Group (APG) Raised Its Outlook As Investors Ask If The Upside Is Priced In
APi Group earnings trigger fresh interest in the stock
APi Group (APG) just put fresh numbers on the table. Third quarter 2026 results and a raised full year outlook have pulled attention back to how this fire and life safety specialist is executing.
The latest report centered on better than expected revenue, record project backlog, and traction in recurring inspection and service work. Those details now frame how investors think about APi Group’s earnings power and risk profile.
Since the start of 2026, APi Group’s share price return of 13.78% has leaned on a series of upbeat updates, with this latest earnings beat and raised outlook following earlier commentary around record backlog, even though the stock eased 1.51% on the day of the release. Over a longer stretch, total shareholder return of 23.92% over one year and very strong three and five year total shareholder returns indicate that recent momentum reflects a much bigger rerating story rather than a short term bounce.
Scan APi Group alongside a curated set of infrastructure and services peers that also screen well on fundamentals using our list of solid balance sheet and fundamentals (24 results).
Recent gains in APi Group appear closely tied to record backlog and recurring services, while the small pullback around results hints at more cautious sentiment. How does that mix of business progress and mood show up in the valuation?
Most Popular Narrative: 19% Undervalued
APi Group last closed at $44.34, while the most followed narrative pegs fair value near $54.73. This points to a material valuation gap that investors now weigh against the company’s backlog strength and recurring inspection mix.
Strong, sustained demand for inspection, service, and monitoring activities driven by heightened safety regulations and compliance needs is expanding APi Group's stable, higher-margin recurring revenue base, directly supporting improvements in net margins and earnings quality.
See why 10 investors see APi Group as 19% undervalued.
Result: Fair Value of $54.73 (UNDERVALUED)
Still, rising material costs in Specialty Services, and any stumble on integrating acquisitions, could quickly challenge the current APi Group upside narrative.
Find out about the key risks to this APi Group narrative.
Another View: APi Group looks expensive on sales
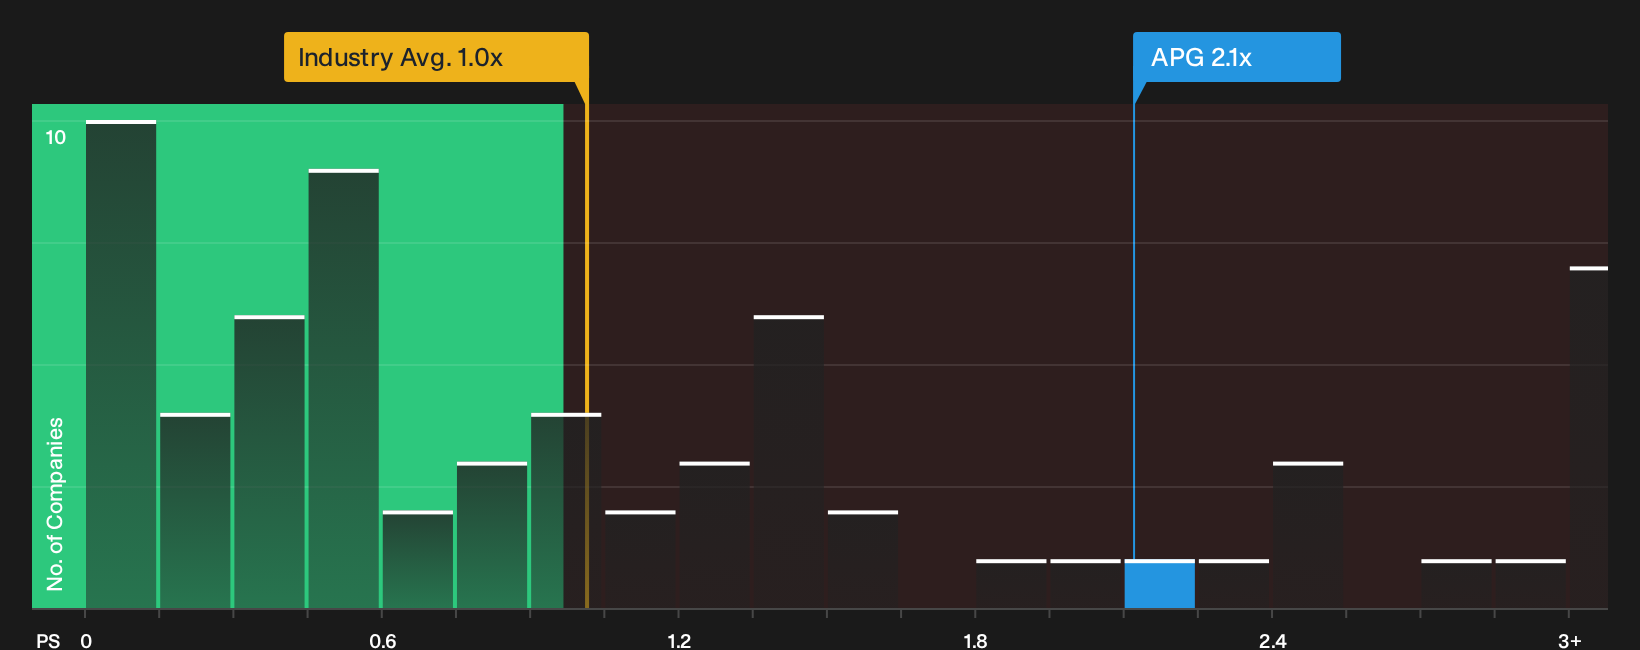
The DCF work suggests APi Group trades below estimated cash flow value. On simple sales maths, the picture is less generous. APG changes hands at a P/S of 2.1x, compared with 1x for the US Construction industry and 1.3x for peers, while the fair ratio sits nearer 2.3x. That gap points to less obvious upside and more sensitivity if expectations slip.
To see how this sales based view stacks up against earnings driven fair value estimates, See what the numbers say about this price — find out in our valuation breakdown..
Next Steps
Optimistic about APi Group after reading this, or still on the fence? Act quickly, pressure test the upside case, and weigh the 3 key rewards.
Looking for more APi Group sized investment ideas?
Do not stop with APi Group. Use the momentum from this review to line up your next candidates now, before the best opportunities move out of reach.
- Target resilient cash generators by scanning a 29 resilient stocks with low risk scores that filters for companies with sturdier profiles when conditions get choppy.
- Hunt for mispriced quality with the 36 high quality undervalued stocks and quickly spot businesses where fundamentals and current prices are out of sync.
- Get ahead of the crowd by combing through 19 high quality undiscovered gems that highlight solid operators flying under most investors' radar.
Have feedback on this article? Concerned about the content? Get in touch with us directly. Alternatively, email editorial-team@simplywallst.com