
Berkshire Hathaway (BRK.A) Could Be 4% Overvalued As ETF Demand Builds
Berkshire Hathaway (BRK.A) is back in focus after a sharp build up of ETF interest, with funds such as XLF and IWD collectively adding millions of dollars in fresh positions.
The renewed ETF demand is arriving as Berkshire Hathaway’s 1 month share price return of 10.58% and year to date share price return of 12.16% point to building momentum. At the same time, a 1 year total shareholder return of 17.20% and 5 year total shareholder return of 91.78% suggest investors have been rewarded over longer holding periods despite mixed headlines around newer equity picks and portfolio reshuffling.
Scan how other high quality value plays are reacting to money flowing back into Berkshire Hathaway using our curated list of 34 high quality undervalued stocks.
Berkshire Hathaway has sprinted higher, ETF cash is leaning in, yet newer investments have thrown up missteps. Does that recent surge still leave enough upside to compensate for the bumps in the portfolio when you look at valuation next?
Most Popular Narrative: 4.4% Overvalued
The most followed narrative pegs Berkshire Hathaway's fair value at $799,502.75, slightly below the last close of $834,640.73. This frames today’s price as a mild premium that depends on a few key business shifts playing out as expected.
The acquisition of Taylor Morrison for US$6.8b, incremental positions in other homebuilders and full ownership of multifamily lender MF1 increase Berkshire Hathaway’s exposure to U.S. housing and apartment finance. Yet near term affordability and credit headwinds at MF1 may cap the uplift to group revenue and earnings.
See why 11 investors see Berkshire Hathaway as 4% overvalued.
Result: Fair Value of $799,502.75 (OVERVALUED)
Still, Berkshire Hathaway’s story can change quickly if community resistance limits new data center power deals or if confidence in post Buffett leadership slips and compresses the P/E multiple.
Find out about the key risks to this Berkshire Hathaway narrative.
Another View: Berkshire Hathaway Through Earnings Ratios
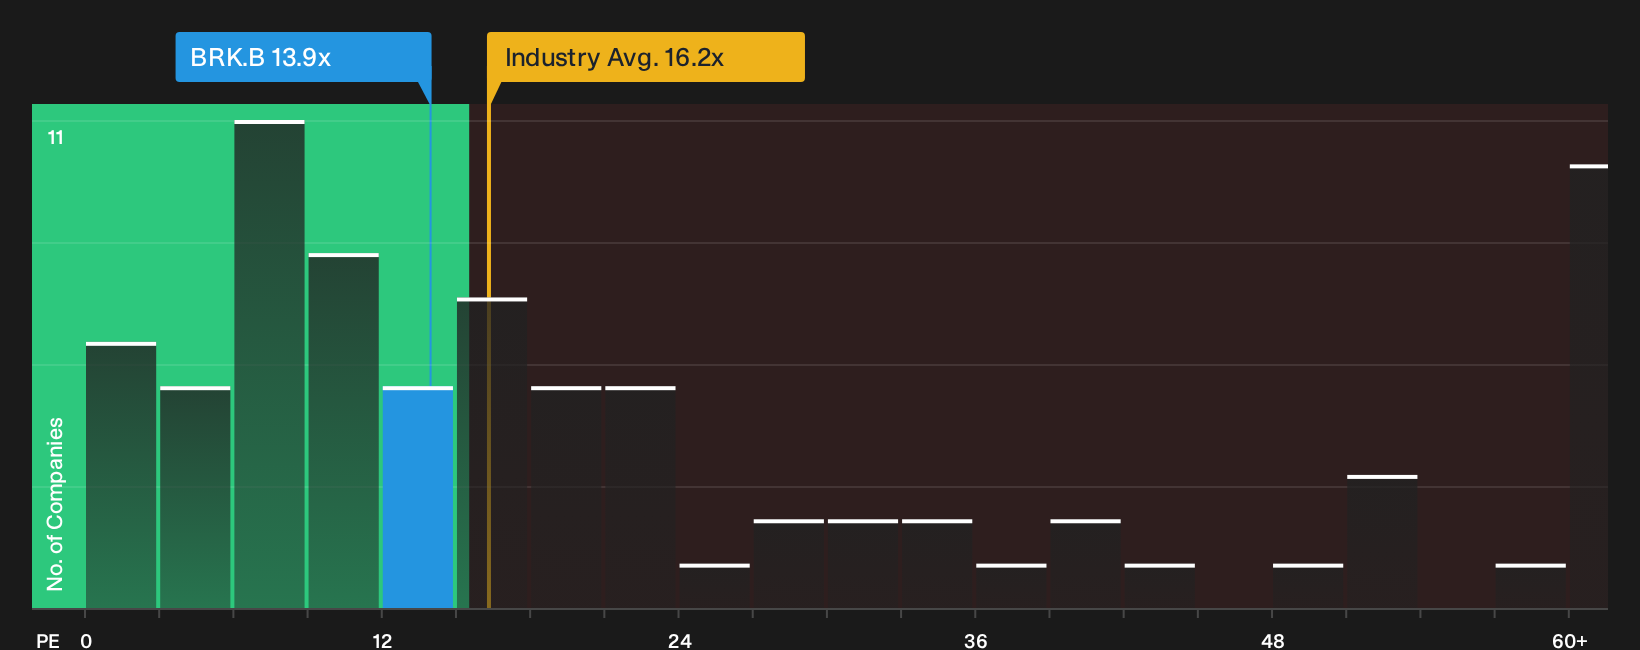
Analyst targets suggest Berkshire Hathaway trades at a mild premium to fair value. A different lens tells a softer story. The current P/E of 13.9x sits below the US Diversified Financial industry at 16.2x and the peer average at 23.7x, and below an estimated fair ratio of 16.5x.
That gap points to investors paying less for each dollar of earnings than both peers and the fair ratio imply. This may limit downside if sentiment cools, but it could also reflect doubts about future profit trends. Which explanation do you think fits the stock best right now?
See what the numbers say about this price — find out in our valuation breakdown.
Next Steps
Mixed signals around Berkshire Hathaway can feel confusing, so shift quickly from headline impressions to the actual numbers and weigh both sides of the story. To balance the concerns with the upside that other investors are watching, review the 3 key rewards and 1 important warning sign
Looking for more Berkshire Hathaway sized ideas?
If you only stop at Berkshire Hathaway, you risk missing other opportunities that fit your style and risk tolerance in a far more precise way.
- Target income-heavy opportunities by scanning companies that screen as potential 4 dividend fortresses and see which payouts may better match your cash flow goals.
- Hunt for underappreciated potential by reviewing a curated 19 high quality undiscovered gems that filters for quality traits many investors overlook.
- Prioritise resilience first by checking a focused 29 resilient stocks with low risk scores that highlights businesses with lower risk scores and steadier profiles.
Have feedback on this article? Concerned about the content? Get in touch with us directly. Alternatively, email editorial-team@simplywallst.com