
John Wiley & Sons (WLY) Adds New Journals As Valuation Stays In Focus
What Wiley’s new journals might mean for WLY shares
John Wiley & Sons (WLY) just added four open access titles to its Advanced Portfolio, extending the journal series to 36 publications and underscoring its push into scalable digital research content.
Investors watching WLY now have a fresh data point to think about. The move speaks to how the publisher is trying to attract more authors, defend research relevance and respond to pressure on traditional subscription models.
Set against that product launch, John Wiley & Sons’ share price has eased over the past week and quarter, yet still shows a 70.27% year-to-date share price return. The 1-year total shareholder return of 42.40% and 3-year total shareholder return of 86.33% point to momentum built over a longer window.
Spot 19 high quality undiscovered gems that, like John Wiley & Sons, are leaning into scalable digital content and research-heavy business models.For John Wiley & Sons, this flurry of new journals could either mirror a sturdier research engine or simply ride a hot share price. Which story do the current valuation markers tell?
Price-to-earnings of 12.8x for John Wiley & Sons: Is it justified?
On the numbers, John Wiley & Sons screens as cheap against both its own cash flow estimate and its sector. The shares last closed at $50.23, while the SWS DCF model points to a future cash flow value of $77.75 and the stock trades on a P/E of 12.8x against a peer average of 36.9x.
The P/E ratio compares what you pay per share today with the earnings that the business currently produces. For content and research publishers like John Wiley & Sons, that can be a useful shorthand for how much the market is willing to pay for every dollar of profit from journals, books and digital learning platforms.
Here, the picture is clear. WLY carries a much lower P/E than both the US Media industry average of 22.3x and the peer group at 36.9x, while also sitting below an estimated fair P/E of 14.2x. That combination suggests the market is pricing WLY more cautiously than those benchmarks, even though the SWS DCF model indicates the share price is 35.4% below its future cash flow value.
Explore the SWS fair ratio for John Wiley & Sons.
Result: Price-to-earnings of 12.8x (UNDERVALUED)
Still, the story for John Wiley & Sons can shift quickly if open access publishing economics tighten, or if library budgets and education spending come under pressure.
Find out about the key risks to this John Wiley & Sons narrative.
Another view on John Wiley & Sons’ value
The SWS DCF model also points to John Wiley & Sons as undervalued, with an estimated future cash flow value of $77.75 against the current $50.23 share price. That gap suggests investors are paying a marked discount for the existing earnings and cash generation profile.
Look into how the SWS DCF model arrives at its fair value.
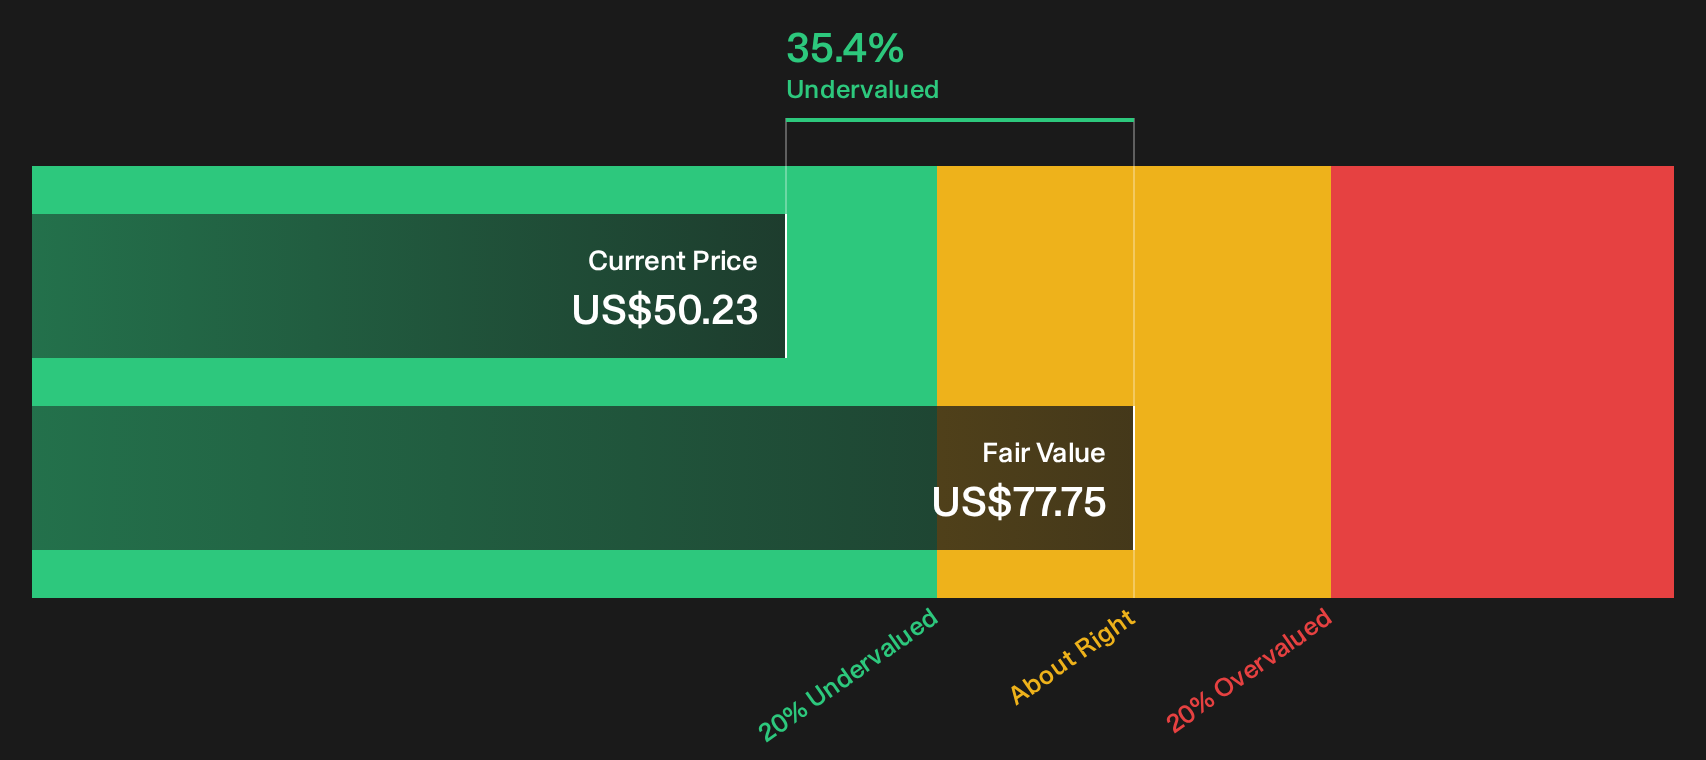
If both the earnings multiple and the SWS DCF model lean the same way, the key question is whether future research and learning cash flows will line up with those assumptions, or instead differ in either direction.
Simply Wall St performs a discounted cash flow (DCF) on every stock in the world every day (check out John Wiley & Sons for example). We show the entire calculation in full. You can track the result in your watchlist or portfolio and be alerted when this changes, or use our stock screener to discover 38 high quality undervalued stocks. If you save a screener we even alert you when new companies match - so you never miss a potential opportunity.
Next Steps
If this combination of discounted P/E and strong journal expansion leaves you undecided, consider quickly stress testing the potential upside and downside yourself. To review both aspects in one place, start with the 5 key rewards and 2 important warning signs.
Looking for more ideas beyond John Wiley & Sons?
If John Wiley & Sons has sharpened your focus on value, do not stop here. The broader market still holds plenty of underappreciated stories worth your time.
- Target potential value upside by scanning companies that screen as mispriced on quality and valuation through the 38 high quality undervalued stocks.
- Prioritize resilience by zeroing in on businesses with strong finances and low risk scores using the 31 resilient stocks with low risk scores.
- Get ahead of the crowd by tracking a 9 elite penny stocks with strong financials list where smaller companies could be setting up their next move.
Have feedback on this article? Concerned about the content? Get in touch with us directly. Alternatively, email editorial-team@simplywallst.com