
Why Graham Holdings (GHC) Is Getting Attention Today
Mixed earnings picture puts Graham Holdings in focus
Graham Holdings (GHC) moved into the spotlight after its third quarter and nine month 2026 earnings update showed higher revenue for both periods but contrasting net income trends that investors are now parsing closely.
The recent earnings release and the appointment of Robert J. Mylod Jr. to the Graham Holdings board landed against a backdrop of steady gains, with the share price at US$1,212.02 and a year to date share price return of 11.47%.
Short term momentum has been positive, with 30 day and 90 day share price returns of 3.31% and 3.25% respectively. Longer term investors have seen a 3 year total shareholder return of 101.49% and a 5 year total shareholder return of 114.35%, which points to momentum that has been building over time rather than fading quickly.
Spot fresh ideas with a similar mixed-earnings and momentum profile by scanning our curated list of 39 high quality undervalued stocks alongside Graham Holdings.After this kind of run and with mixed quarterly earnings, the real debate on Graham Holdings now is simple: Is most of the upside already reflected in the US$1,212 share price, or not yet?
Preferred P/E of 10.3x for Graham Holdings: Is it justified?
On valuation, the market is currently paying a P/E of 10.3x for Graham Holdings, which sits below both its Consumer Services peer group on 11.5x and the wider US Consumer Services industry on 11.8x. With the shares last closing at $1,212.02, that discount hints at more cautious expectations around Graham Holdings' earnings profile compared with similar businesses.
The P/E ratio links the share price to earnings per share, so it gives a quick sense of how much investors are willing to pay for each dollar of profit. For a diversified group like Graham Holdings, which operates across education, broadcasting, healthcare and industrial operations, this single number compresses a wide mix of earnings qualities, cash flow profiles and competitive positions into one headline yardstick.
There is useful context behind that headline multiple. GHC's reported earnings have grown by 19.6% per year over the past 5 years, yet profit over the most recent year declined 32.5% and net profit margins moved from 14.8% down to 9.6%. High quality earnings are flagged, but the fall in recent profitability, a 10.4% Return on Equity that is described as low, and revenue that is forecast to grow 5.5% per year, slower than the broader US market, all help explain why the market price is not awarding a higher earnings multiple.
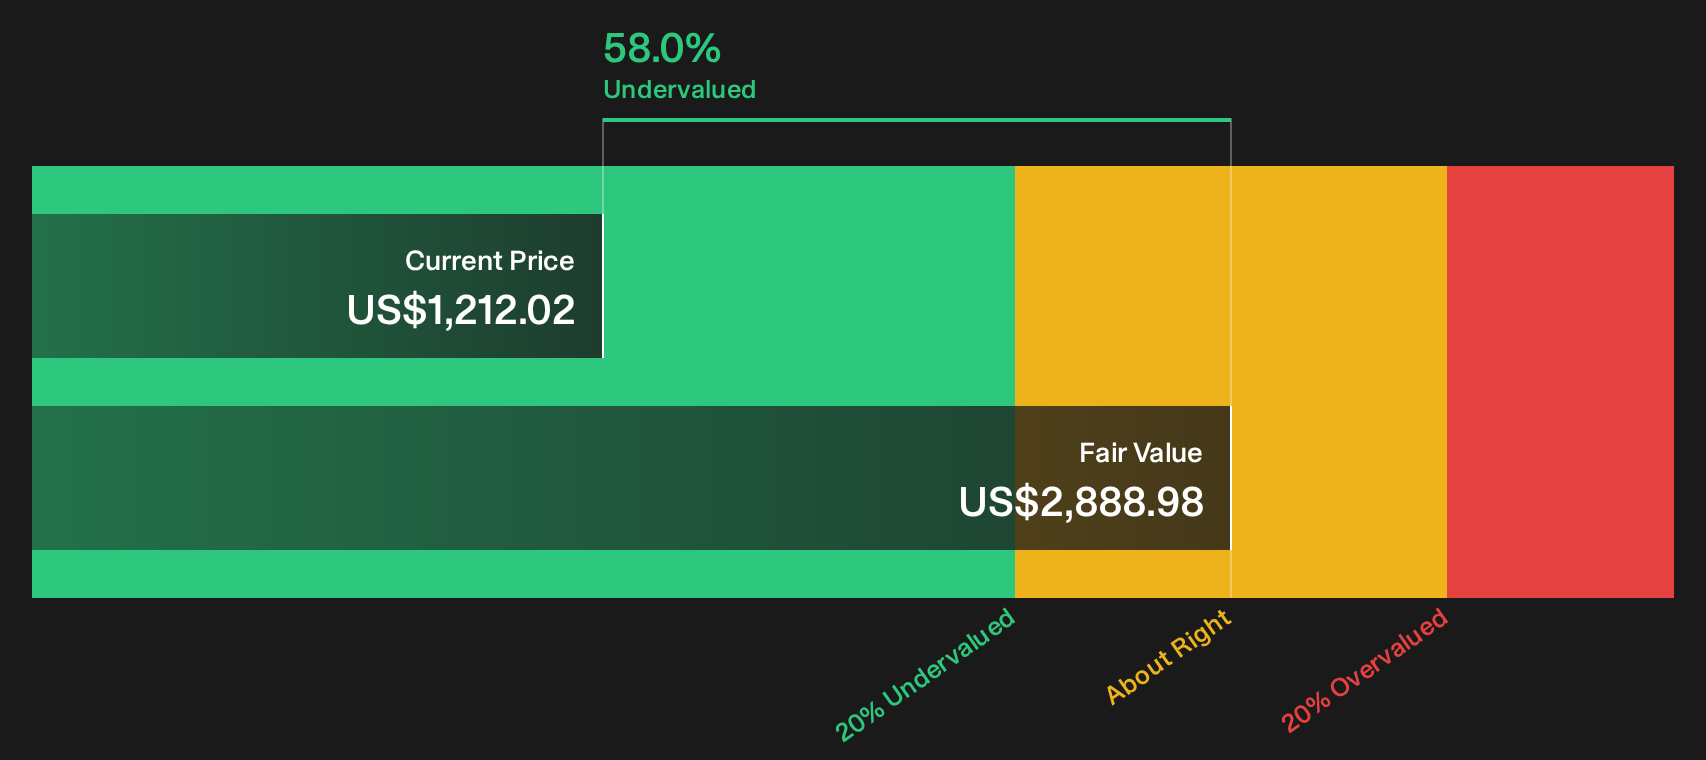
Against the US Consumer Services industry specifically, the comparison is clear. Investors are paying less for each dollar of Graham Holdings' earnings than for the average Consumer Services stock, despite the business trading at a 58% discount to the SWS DCF estimate of future cash flow value of $2,888.98. The gap between the 10.3x P/E and the higher industry averages points to the market pricing in more muted expectations for future earnings progress relative to peers.
See what the numbers say about this price — find out in our valuation breakdown.
Result: Price-to-earnings of 10.3x (UNDERVALUED)
Still, Graham Holdings faces real pressure points, including a recent 32.5% drop in annual profit and a board view that prices already sit above a US$1,100 target.
Find out about the key risks to this Graham Holdings narrative.
Another view on Graham Holdings’ valuation
The earnings multiple paints Graham Holdings as modestly priced. A different lens tells a much stronger story. The SWS DCF model values the shares at $2,888.98 per share, compared with the current $1,212.02, which signals a very wide gap between price and estimated cash flow value.
That kind of discount raises a practical question for you as an investor. Is the DCF capturing durable cash generation that the market is choosing to ignore, or is the lower share price a simple reflection of recent profit pressure and slower forecast revenue growth?
Look into how the SWS DCF model arrives at its fair value.
Simply Wall St performs a discounted cash flow (DCF) on every stock in the world every day (check out Graham Holdings for example). We show the entire calculation in full. You can track the result in your watchlist or portfolio and be alerted when this changes, or use our stock screener to discover 39 high quality undervalued stocks. If you save a screener we even alert you when new companies match - so you never miss a potential opportunity.
Next Steps
Mixed signals around Graham Holdings can feel confusing, so now is the time to look through the numbers yourself and pressure test the story on your own terms. To help you weigh the upside against the potential downsides in a structured way, start by reviewing the 1 key reward and 1 important warning sign.
Looking for more investment ideas beyond Graham Holdings?
If Graham Holdings has you thinking more carefully about price, quality, and risk, now is a good moment to widen the lens and compare it with other stocks.
Use the Simply Wall St Screener to find fresh opportunities that fit your style before they move out of reach.
- Target value and quality together by scanning a focused set of companies through the 39 high quality undervalued stocks.
- Strengthen portfolio resilience by lining up candidates from the 31 resilient stocks with low risk scores.
- Hunt for potential future leaders hiding in plain sight with the 19 high quality undiscovered gems.
Have feedback on this article? Concerned about the content? Get in touch with us directly. Alternatively, email editorial-team@simplywallst.com