
Mortgage-Backed Securities & Preferreds Suffer 2.5-Sigma Declines After Hotter-Than-Expected CPI by John Salama, CMT
John Salama, CMT
ETF Market Strategist & Derivatives Trader | CMT | Author, Physical Over Digital Alpha | Featured Author, Barchart | 500+ Institutional Subscribers
YouTube.com: HOT CPI SPARK CRAMS MORTGAGES & PREFERREDS! | Trading Trends with John Salama, CMT
Last night, I attended a CMT Association panel featuring three institutional-grade practitioners: Christopher Cain, CQF, CMT a quant factor strategist from Bloomberg Intelligence, a bottom-up fundamental equity analyst and former Visible Alpha exec Melissa Otto, CFA now at S&P Global, and a 25-year Wall Street technical analyst and founder of Cap Thesis Frank Cappelleri, CFA, CMT . The discussion ran the full stack; macro backdrop, factor performance, AI capex sustainability, and emerging markets rotation.
The consensus: momentum has completely unwound (long/short factor went from +30% to flat since July), value has been the stealth winner of 2026, and low-volatility is staging a historic comeback. The AI trade isn’t dead, but it’s repricing; hyperscaler capex estimates of +$3T through 2028 are starting to face analyst pushback, and the market is asking a simple question: when does the revenue catch up to the spend? The technical read was equally honest; SPY is a jump ball, bearish patterns are appearing for the first time since March, and the VIX spike (while dramatic on a percentage basis) never reached the historically actionable threshold above 28-29 that has correlated with true mean-reversion trades. Bitcoin got a shoutout as the non-consensus idea. So did cyclical value.
It was exactly the kind of room I like: technicians, quants, and fundamentalists talking to each other instead of past each other. Now back to today’s action.
Hot CPI landed this morning and the bond market felt every basis point of it. The Fed is now almost certainly hiking in December, and the market repriced that reality in real time. The two clearest casualties: mortgage-backed securities and preferred stocks: both logging 2.5-sigma declines, the kind of move you respect regardless of your directional bias. No sigma gainers today. The dollar ripped. Everything with duration got taken out back.
Equities are holding in relative to fixed income, but SPY is not healthy. We’re 13 points below the $760 line, the 21-day exponential moving average, and that is my line in the sand for any conviction on the upside. Under 760, I do not believe in a thrust to new all-time highs. VWAP on the day is 748 and the market can’t seem to hold it. 14d RSI at 43, stochastics weak; this is pathetic price action. Range-bound is the base case. I’m watching 743 as a potential magnet if sellers pick up conviction, and 731 (rising 200-day MA) as the structural floor. Two consecutive closes below 731 and the thesis changes.
The divergence story of the week: the trades that worked were entirely outside of tech and crypto. Natural gas, gold miners, airlines — that’s your alpha. Know what you own.
STANDARD DEVIATION ANALYSIS
Sorted by Sigma Magnitude
Today’s Sigma Losers: No Gainers Registered
ETF Move Sigma Why
MBB iShares MBS ETF -1.5% -2.5σ Hot CPI → rates higher → extended duration, less refi demand, existing paper worth less
PGX Invesco Preferred ETF -1.7% -2.5σ Fixed-dividend, long-duration hybrid. Rate rip = price collapse. 7 cents from 52-week low at $9.81
MBB peaked at $97 end of February, bottomed the day the S&P made all-time high, now targeting a $90 handle. RSI 48. Stochastics peaking, not constructive. Prior support at $92.5 (pre-Labor Day) is now overhead resistance. Liquidity too thin for options; this is a macro read, not a vol trade.
PGX: $9.90 name with a $0.12 ATR: it doesn’t move much, which makes today’s -1.7% a statement. This is a relative strength breakdown. 52-week low is $9.81. I’m targeting $9.65 within two weeks. Implications: weaker bond prices, higher rates ahead.
SPY VOL SURFACE WATCH
SPY Nov 20 Expiry | 10 DTE
Price: ~748
ATM IV: 17.5%
Historical Vol: 18.4%
IV Rank: 37.1%
IV Rank at 37 tells me vol is bid but not screaming. Premiums are worth collecting on the upside. The options market is not panicking; this is methodical, not fearful. That’s why I’m not reaching for outright puts here. You’d need a break below 730 to get paid on downside premium, and you’re buying insurance after the fire started.
Tactical Trades SPY:
Sell the Nov 27 770 calls ($1.50) / 715 puts ($2.95) strangle for $4.45 collect premium assuming range-bound into Thanksgiving
Want to sell the 730 puts outright? Worst case you get assigned the biggest 500 companies in the world at 730 at 6-month lows which is a 27d option. I’ll consider that.
Do NOT buy January 780 calls here. Blue skies thesis is not supported by the chart.
How I know I’m wrong: two consecutive closes below 731 and I reassess everything.
SIGMA MOVERS: 5-DAY LEADERBOARD
Top 3 Gainers of the Past 5 Days
UNG US Natural Gas Fund | +12% All-time low Halloween Eve at $8.94. Now $10.4. 21-day EMA at $9.78 is finally crawling higher after stabilizing, constructive. RSI approaching 59, which is where nat gas typically lets go. I want one more bullish week. Target: $10.80. Floor: $9.1. The AI power demand thesis is real; hyperscalers are projected to represent nearly a third of all U.S. electricity spend by 2030. You can’t AI natural gas yet. That’s potentially the edge. Trade: Buy Jan 11 calls. Exit calls when approaching in-the-money or by Nov 18.
GDX VanEck Gold Miners ETF | +11% This one already hit my target. I had November 3rd as the entry date with a target of $92; it got there yesterday, hit $92 exactly, and is now back at $86. We’re at resistance. 200-day MA is $90. After four consecutive green days, the pattern historically rolls over here, happened end of August too. Gold itself is barely off the mat near its 52-week lows. You’re mining for an asset getting more expensive to find while the asset price is depressed. Late innings on this rally. Trade: Would consider selling Nov 27 $80 puts at $1.03 if Delta and IV cooperate.
JETS US Global Jets ETF | +8.7% Airlines are the clearest beneficiary of oil’s -10% five-day slide. Delta, American, United margins improve directly. JETS bottomed end of March at $23.50 then peaked August 5th at $34, and has been above its 200-day MA for six days — the first time since late summer. Near-term resistance: $30.50. VWAP today: $30.1. They rejected it by $0.1. Yesterday was a +5% session. After that kind of move, stochastics can peak and you typically get a fade. Trade: Sell Nov 27 $32 calls at 0.45 to collect on the exhaustion. Or buy Jan $28 puts for 0.95, exit when in-the-money over next 2–3 weeks. I would be careful chasing longs here.
Top 3 Losers of the Past 5 Days
ETHA iShares Ethereum Trust ETF | -12% Ethereum is my inverse VIX. When greed is running, it rips. When fear enters, it’s the first thing sold. ETHA peaked at $78 last December, troughed June 26th. Got overbought August 21st and stayed there a week and a half but now back below the 200-day MA for the first time since August 20th. RSI hasn’t held 50 since October 7th. That’s four weeks of deterioration. The 1-for-3 split (they needed it above $45 for options liquidity and market maker participation) papered over the weakness. Down 4% today, down 12% in five days. VWAP $46.15 — rejected by a nickel with 2 hours of trading to go. Trade: I would NOT chase puts here; you’re buying after the hurricane. Wait for a close above $49, then buy Jan $53 calls on the dead cat bounce to $52. If you must play downside: Jan $45 puts, but you’re late.
USO US Oil Fund | -10% USO is still the number one ETF year-over-year at +98%. Let that sink in. It doubled. No leverage. No AI. Just oil. But we flagged the bearish RSI divergence at multi-year highs ($172 on Halloween Eve); price made a new high, RSI couldn’t get to 68. That divergence was the tell. Now at $141, below my $144 lower bound target. Stochastics are near July lows; same level where oil found its floor in early July near the rising 200-day MA. That structural support is roughly 10% away now. I still like oil. The year-long money flow is magnificent. Hasn’t flirted with the 200-day since late January. Trade: Wait for base. Need closes above $150 before touching Jan $155 calls. Would consider selling Nov 27 $128 puts at 1.50— but not yet today. Ultimate support: $127 its 200dma.
EWY iShares MSCI South Korea ETF | -10% EWY was the number three ETF of the year at +46%; Samsung, SK Hynix, the AI memory trade. That was then. The day after the midterms, EWY plunged 13% to $132, Valentine’s Day prices. The old support at $163.50 is for now hard resistance. 200-day MA at same level, confirmation. RSI hit 50 on October 28th and they let it go immediately. The Prime Minister was sending out crisis hotlines after a -13% session on November 5th, people are margined to their eyeballs in this name. Trade: Sell Nov 27 $157 calls at 1.15. Consider selling strangles given elevated vol post-decline. Watch $131.50 — if that breaks, targeting $110–115. Jan $135 puts exist but are expensive post-hurricane. 52-week low is $87. Do not step in front of this.
STRATEGIC OUTLOOK
The AI trade is not over... but it is changing. The question I keep coming back to: when does the market decide that hyper scaler capex projections were overdone? Three years ago, they were spending ~$80B. Now it’s $2T+ over the next 24 months. The analysts who’ve been sandbagging estimates and watching earnings beat consistently are starting to push back. Applied Materials earnings Thursday and Nvidia next week will be the tell. Jensen Huang and the national security overhang is a real variable. NVDA down 6% today on the news. SMH down 1.5%. Intel down 3%. Micron down 3%.
The AI trade ends when the S&P makes successive closes below its 200-day moving average at 731 and that average turns south. We are not there. That 731 level was first discovered on Cinco de Mayo, about a month post-ceasefire, and it has held. Respect the rising 200-day until it stops rising.
The rotation is real. Value, defensives, healthcare, staples; money has been flowing there since the October all-time high. The midterm certainty bounce was real for one day (+1.6%) and then immediately sold (-4.5%) as the market digested what Democrat regulatory posture means for data center buildout projections. That’s not a bearish macro signal, that’s repricing. The bull market in oil, biotech (ARKG +62%), and hard assets is the story of this year. If you owned USO, ARKG, and EWY you captured +206% combined from the year’s top three ETFs.
NVDA and the semis will get their moment again. But right now, they are not the leader.
TOP 3 CHARTS
[1-Year Barchart RSI-14 — Available at barchart.com/get-barchart-premier?fpr=h1fuww]
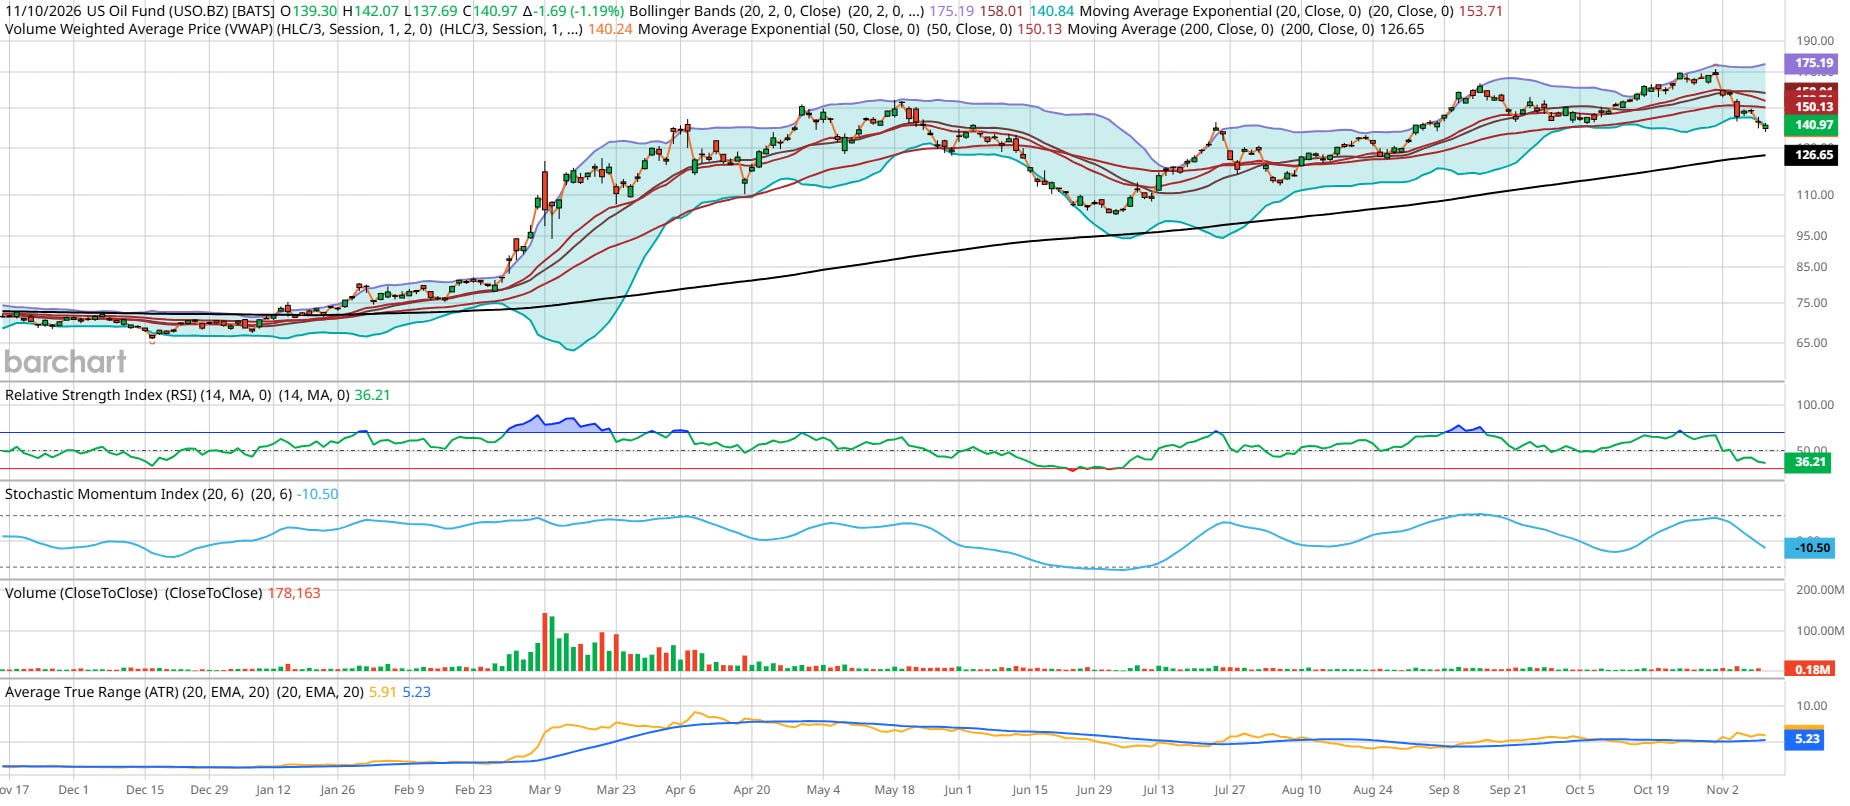
USO Year-to-date leader +98%. Watch $141 as base. 200-day rising since January.
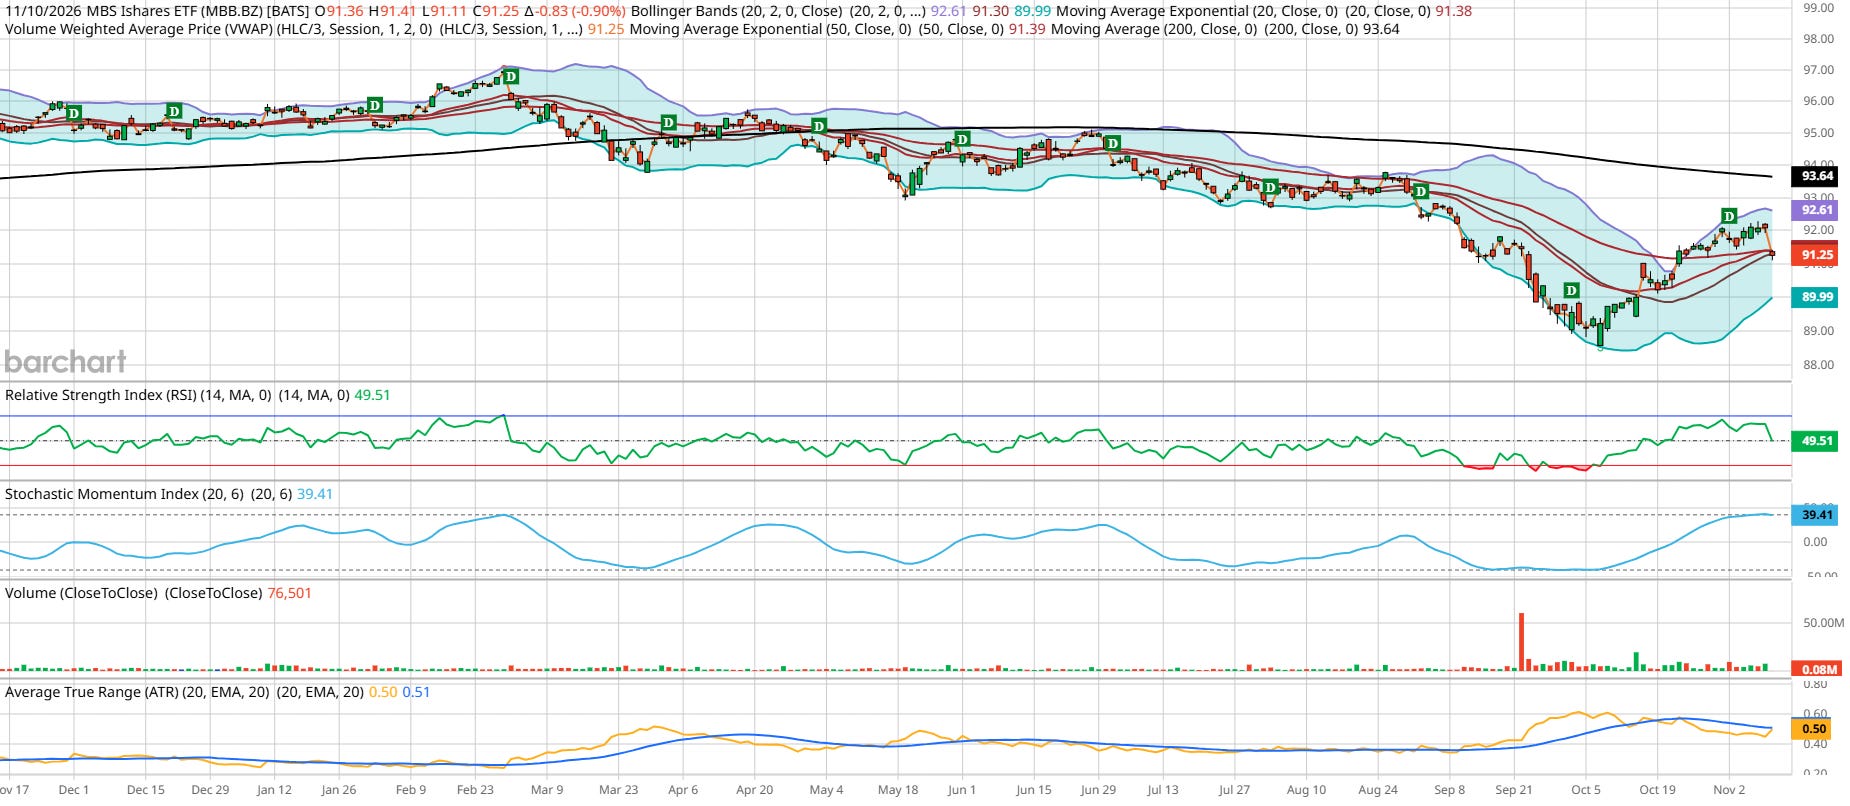
MBB 2.5-sigma breakdown. 200-day falling. Targeting $90 handle. Prior support at $92.25 now resistance.
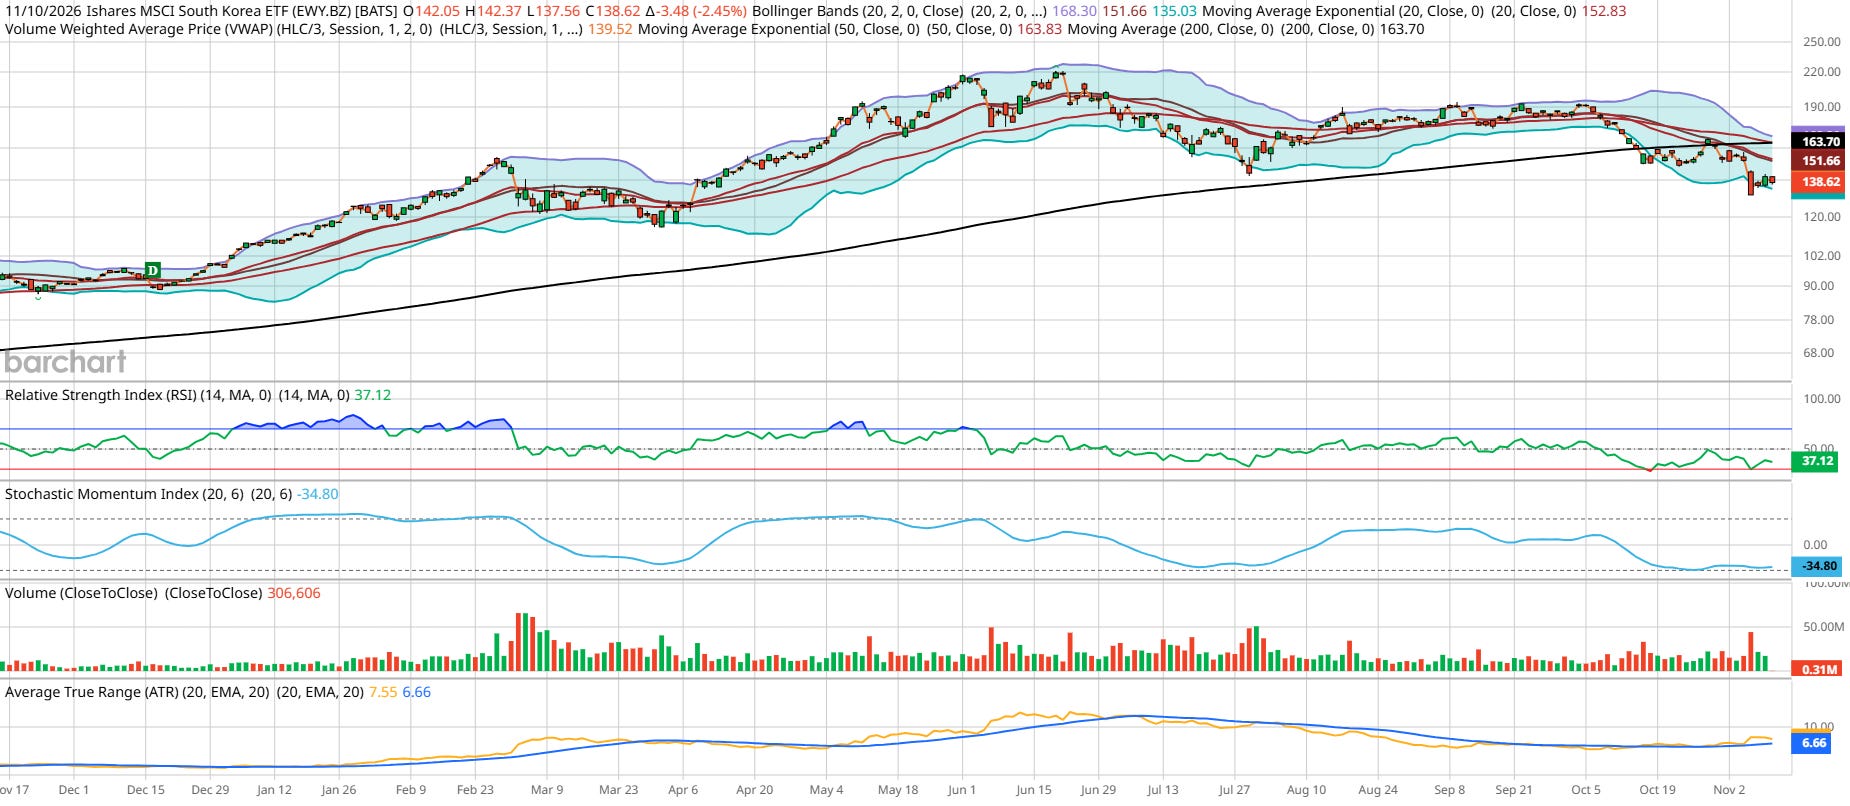
EWY Year’s third-best ETF now living below its 200-day for nearly a month. $164 is the wall. $132 is the floor to watch.
Trading Trends is published by John Salama, CMT. Options involve risk and are not suitable for all investors. This is not financial advice. Data sourced from Barchart Premier — barchart.com/get-barchart-premier?fpr=h1fuww