
Seaboard (SEB) Earnings And Dividend Put Valuation Back In Focus
Seaboard earnings and dividend move into focus
Seaboard (SEB) is back on investors’ radar after its latest earnings report and a fresh quarterly dividend declaration, pairing updated profit figures with a confirmed cash payout to shareholders.
The latest earnings and dividend update lands after a mixed price stretch for Seaboard, with the share price climbing 10.4% over the past week but still down 14.9% year to date and 10.4% over 90 days, while the 3 year total shareholder return of 6.4% points to only modest long run progress.
Scan how Seaboard's mix of earnings swings and a fresh dividend stacks up against other potential opportunities by reviewing our hand picked 35 high quality undervalued stocks.
Seaboard looks like a heavyweight business across pork, trading and shipping, yet the share price slide this year raises a sharper question. After the recent rebound and dividend, does the current tag still look reasonable?
Price-to-earnings of 6.5x: Is it justified?
On a simple P/E lens, Seaboard trades on 6.5x earnings, which is a low tag relative to both the wider US market and its direct food peers. With the last close at $3,765, that multiple suggests investors are pricing the business at a discount to many other listed food producers despite its sizeable operations.
The P/E ratio compares the current share price to earnings per share and is a quick shorthand for how much you are paying for each dollar of profit. For a diversified group like Seaboard that spans pork, commodity trading, shipping and power, it gives a rough gauge of how the market is weighing its earnings profile against other listed food and agriculture groups.
Seaboard screens as good value on this metric, with a 6.5x P/E sitting well below the US Food industry average of 19x and under the broader US market on 17.7x. The discount is clear and suggests the market is putting a lower tag on its earnings than it does for typical sector and index constituents, even though earnings grew 37.1% over the past year and profit margins improved to 5.3% from 4.1%, helped by one off items.
See what the numbers say about this price — find out in our valuation breakdown.
Result: Price-to-earnings of 6.5x (UNDERVALUED)
Still, the Seaboard pitch carries obvious risks, including exposure to volatile commodity markets and a share price that has already fallen sharply this year.
Find out about the key risks to this Seaboard narrative.
Another view on Seaboard’s valuation
That low 6.5x P/E paints Seaboard as cheap, yet our DCF model tells a different story. On this measure, the stock at $3,765 screens as overvalued relative to an estimated future cash flow value of $254.52 per share. Which lens should carry more weight for you?
Look into how the SWS DCF model arrives at its fair value.
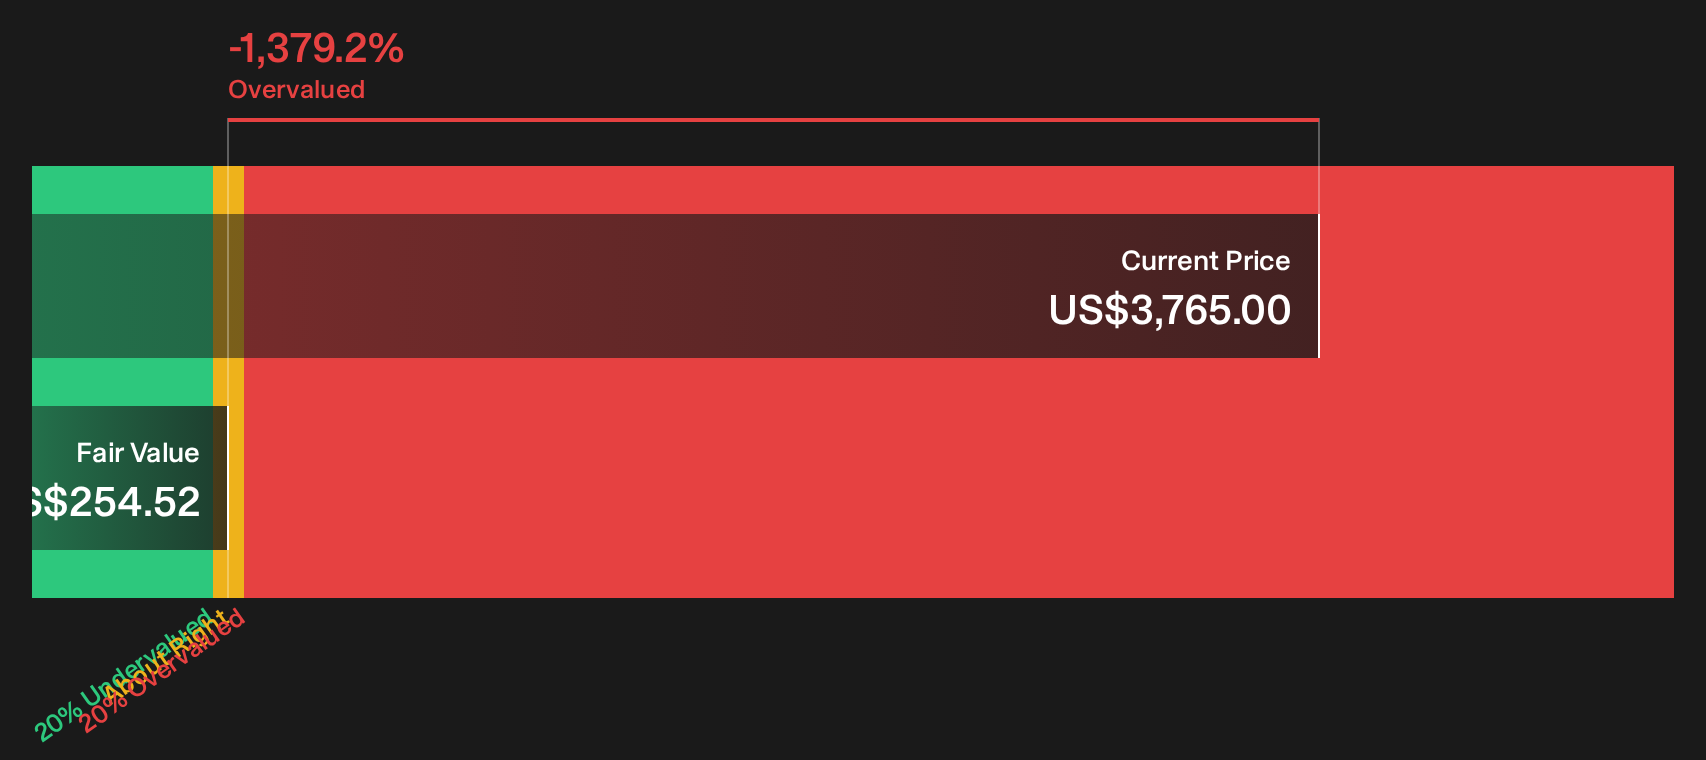
Simply Wall St performs a discounted cash flow (DCF) on every stock in the world every day (check out Seaboard for example). We show the entire calculation in full. You can track the result in your watchlist or portfolio and be alerted when this changes, or use our stock screener to discover 35 high quality undervalued stocks. If you save a screener we even alert you when new companies match - so you never miss a potential opportunity.
Next Steps
Mixed signals on Seaboard so far. If you want a clear view quickly, compare the potential upside and the red flags yourself through the 2 key rewards and 2 important warning signs.
Looking for more investment ideas beyond Seaboard?
If Seaboard has sharpened your focus on value and risk, do not stop here. The right watchlist can tilt the odds toward better long term outcomes.
- Target potential mispricings by scanning a hand picked set of opportunities through the 35 high quality undervalued stocks.
- Lock in income focused ideas by reviewing companies that feature in our 5 dividend fortresses.
- Prioritise resilience by checking businesses highlighted in the 30 resilient stocks with low risk scores.
Have feedback on this article? Concerned about the content? Get in touch with us directly. Alternatively, email editorial-team@simplywallst.com