
Asana (ASAN) Stock Looks Cheap After A 93% Five Year Fall
Asana has seen its share price fall sharply over recent years, which puts fresh focus on a simple question for investors who still follow the stock. Is the current market value supported by the sales Asana is generating today and those it may be able to grow into over time?
- Over the past 5 years, Asana's share price has declined 92.9%, which places even more weight on whether its revenue base can justify what the market is now willing to pay.
- With management set to discuss upcoming financial results on 1 December 2026, any detail on customer growth, spending patterns and operating efficiency can shape how confidently investors treat Asana's future sales stream.
- There is a second opinion on Asana worth weighing. See what analysts think Asana's shares could be worth.
The stock's next move may depend on whether Asana's current share price can be squared with the scale and quality of its sales.
If you are weighing Asana's recent share price fall against its current sales, it can help to compare that trade off with a wider set of 35 high quality undervalued stocks
Does Asana Look Undervalued on Sales?
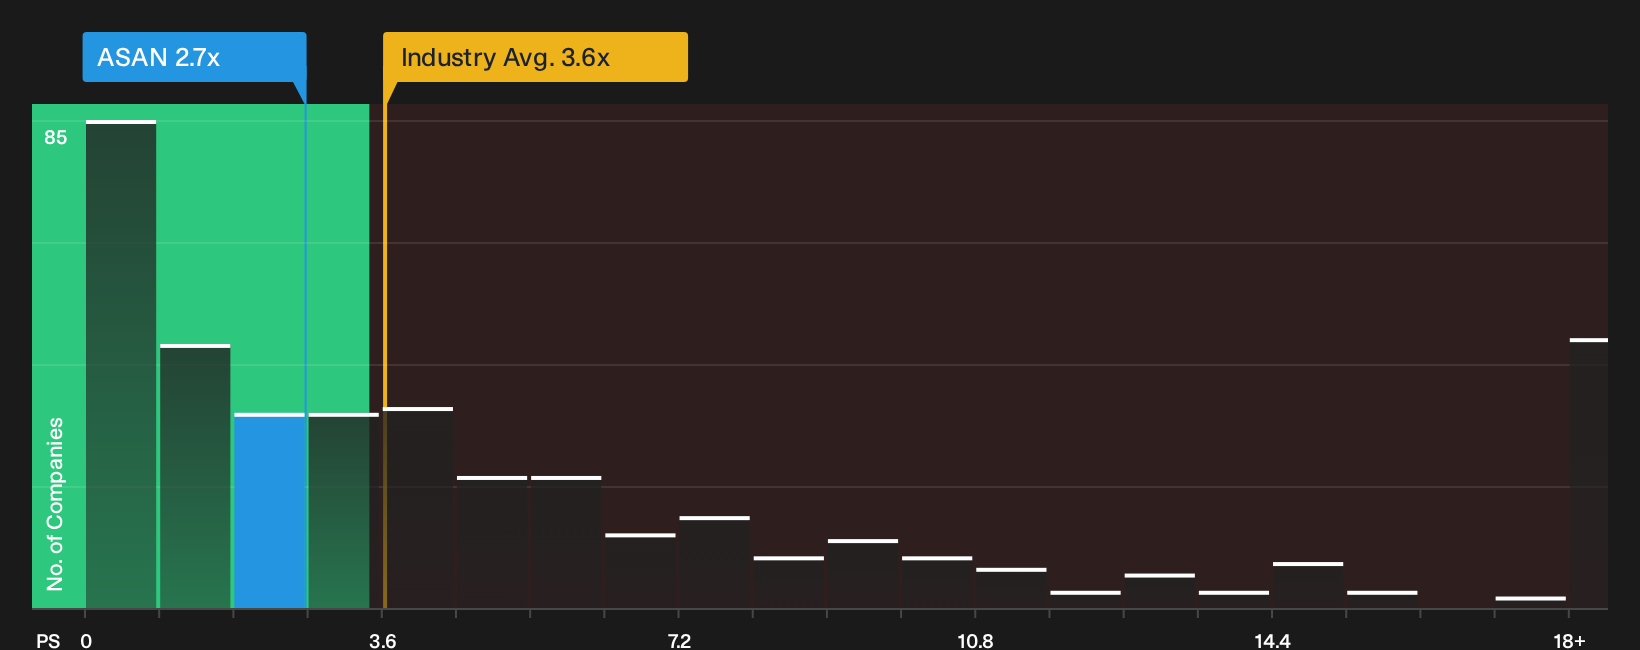
P/S often works better than P/E for a business like Asana that is still focused on scaling and does not yet anchor easily on earnings. On this metric, the stock trades on a P/S of 2.7x, which is below the broader Software sector average of 3.6x and also below the closer peer set at about 6.3x. For a reader, that means each dollar of Asana revenue is currently priced at a discount to what the market is paying for many comparable software platforms.
Because the current P/S sits below the level suggested by a more tailored fair multiple model that factors in Asana's growth profile, margins, size and risk, the shares appear undervalued on this specific yardstick. With Q3 fiscal 2027 results due on 1 December 2026, any update on customer trends and spending patterns will show whether this discounted P/S reflects caution or an opportunity in the eyes of the market. Explore the numbers behind Asana's P/S valuation.
The Asana Narrative: What Would Justify Today's Price?
Asana's Simply Wall St Narratives pick up where this pricing puzzle leaves off. They spell out the specific paths for revenue, profitability and cash generation that would need to play out for the stock to look meaningfully cheaper or more expensive than today. Each narrative ties its valuation number to a clear view on how Asana's growth, margins and risk profile could evolve. This gives you a reference point to come back to as fresh results and guidance arrive.
Bulls and bears are looking at the same Asana AI story and drawing very different conclusions about how much risk is baked in.
Bull case: 6% undervalued
In the analyst consensus Narrative on Simply Wall St, the upside hinges on AI usage turning into stickier customers and a stronger profit engine.
"Asana's integration of AI into structured workflow automation through AI Studio, smart workflows, and AI Teammates now ties directly to roughly 25% of Q2 FY27 net new ARR and a higher full year AI contribution target of about 20%, which can support higher ARPU and revenue growth..."
Discover why this Narrative puts Asana at 6% undervalued.
Bear case: 53% overvalued
The bearish analyst Narrative on Simply Wall St stresses that the same AI mix could weigh on pricing power and profitability if costs and usage do not line up.
"The numbers imply that Asana's current share price assumes a rich outcome in which AI products continue to contribute a rising share of net new ARR, revenue remains near the guided FY27 range, and operating margins hold around the newly raised 10% target despite consumption timing and StackAI cost drags..."
Explore why this Narrative puts Asana at 53% overvalued.
One more Asana check worth weighing beside the price tag
Before treating Asana's valuation story as complete, it helps to know that Simply Wall St's broader checks have flagged specific risk markers that sit outside the sales multiple debate. Take a closer look at 2 warning signs before settling on a valuation.
Have feedback on this article? Concerned about the content? Get in touch with us directly. Alternatively, email editorial-team@simplywallst.com