
Is Ciena (CIEN) Below Fair Value Following Strong Cash Flow And 2027 Growth Outlook?
Ciena (CIEN) just reported Q3 fiscal 2026 free cash flow of US$116 million while increasing working capital, and management is signaling at least 30% revenue growth with margin expansion for fiscal 2027.
Ciena’s share price has fallen 39.5% over the past month and 37% over the last quarter, even as the stock still carries a 10.6% year-to-date share price gain and a 31.2% total shareholder return over one year. This suggests long-term holders have seen strong compounding, while shorter-term momentum has clearly faded as investors reassess growth expectations and risk after a long run up.
Scan other capacity driven opportunities alongside Ciena in our hand picked list of 53 AI infrastructure stocks as investors reassess growth, margins, and cash generation stories across the sector.
Ciena now trades at a steep discount to both analyst targets and intrinsic value estimates after a sharp pullback. Is the market correctly pricing in risk, or is this caution overshooting the fundamentals as they stand today?
Most Popular Narrative: 47% Undervalued
Ciena’s last close at $272.10 sits well below the analyst consensus Narrative fair value of about $513, using an 8.9% discount rate. This frames the current pullback against long term revenue and earnings expectations from the analyst consensus Narrative on Simply Wall St.
Ciena's focus on higher value optical, interconnect and automation solutions, along with pricing and cost actions, has already moved adjusted gross margin to 46.4% and operating margin above 20%. Management now targets about 50% gross margin and 32% to 35% operating margin by 2029, which would materially impact net income and free cash flow if achieved.
See why 58 investors see Ciena as 47% undervalued.
Result: Fair Value of $512.99 (UNDERVALUED)
Still, Ciena’s heavy reliance on a small group of hyperscaler customers, along with ongoing component supply constraints, could quickly challenge the positive expectations for growth and margins.
Find out about the key risks to this Ciena narrative.
Another View: Ciena Through The Earnings Multiple Lens
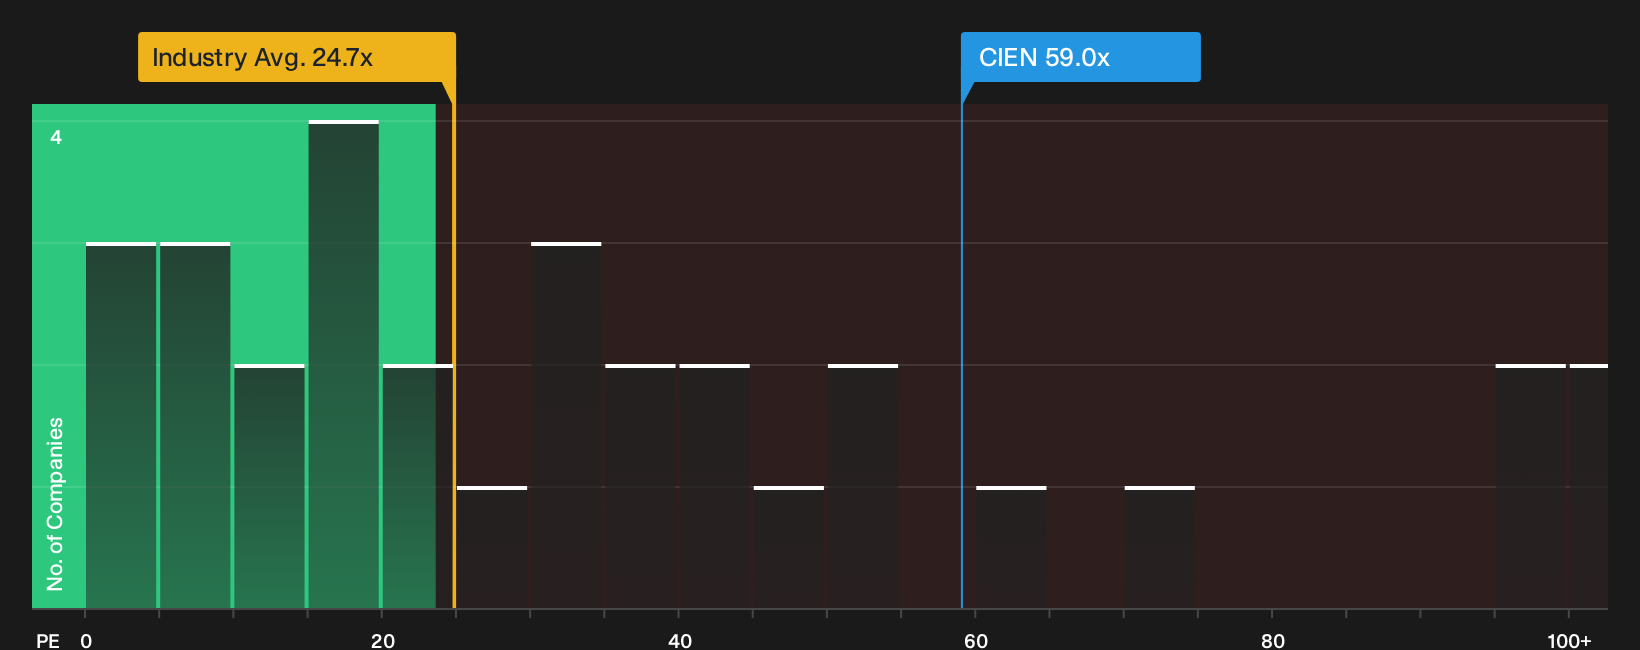
Ciena might screen as undervalued on fair value estimates, yet its P/E of 59x tells a different story. That figure is above the 41.8x fair ratio and well ahead of the 24.7x industry average, while only roughly in line with peers at 60.9x. For investors, that gap points to valuation risk if sentiment cools before earnings catch up, or potential upside if the market leans into growth expectations. Which side of that tradeoff appears more realistic to you right now?
See what the numbers say about this price — find out in our valuation breakdown.
Next Steps
Ciena now carries both clear positives and real question marks, and that mix is exactly why your own judgment matters more than any single model. To weigh the upside against the caution flags in a way that fits your risk tolerance and time horizon, start by reviewing the 3 key rewards and 2 important warning signs.
Looking for more investment ideas beyond Ciena?
If Ciena’s setup has you thinking about portfolio upgrades, keep that energy going with a quick scan for other companies that line up with your goals.
- Target potential bargains early by checking companies that score well on quality and value through the 35 high quality undervalued stocks.
- Strengthen your income stream by reviewing reliable payers and high yields in the 5 dividend fortresses.
- Dial down portfolio risk by focusing on financially resilient businesses using the 30 resilient stocks with low risk scores.
Have feedback on this article? Concerned about the content? Get in touch with us directly. Alternatively, email editorial-team@simplywallst.com