
Is Cabot (CBT) Trading At A Discount Following Mixed Quarterly And Full Year Results?
Quarterly strength against a softer full year
Cabot (CBT) just released fourth quarter and full year results, with the latest quarter showing higher sales and net income, while earnings for the full year moved in the opposite direction.
Investors now have a fresh set of figures to weigh. Quarterly sales reached US$1,009 million compared with US$899 million a year earlier, and net income was US$66 million versus US$43 million in the prior period.
Cabot’s latest figures arrive against a mixed share performance, with the stock at US$72.23 after a 90 day share price return that declined 16.27%, while the 1 year total shareholder return of 20.34% indicates stronger longer term momentum supported by dividends.
Compare Cabot's latest earnings shift with a curated group of materials businesses that pair cash generation with balance-sheet strength using our list of solid balance sheet and fundamentals (24 results)
Cabot’s recent slide over 90 days sits awkwardly next to improving quarterly earnings and a positive 1 year return. Are you looking at a business reset, or a swing in sentiment that valuation now has to explain?
Most Popular Narrative: 18% Undervalued
Cabot’s analyst consensus Narrative on Simply Wall St places fair value at $88.50, above the latest close of $72.23. This points to a discount that investors can compare with their own assumptions about earnings and cash flow. That view is built on detailed forecasts for revenue, profit margins and share count, all run through a 7.67% discount rate.
Ongoing cost reduction and network optimization programs, including targeted capacity rationalizations and process technology deployment, are expected to lower Cabot's cost base, which can support operating margins, cash generation and discretionary free cash flow.
See why 1 investors see Cabot as 18% undervalued.
Result: Fair Value of $88.50 (UNDERVALUED)
Still, parts of the Cabot story could cut both ways. Faster execution in Battery Materials or a sharper recovery in Reinforcement Materials could challenge the idea that the stock simply drifts around current expectations.
Find out about the key risks to this Cabot narrative.
Another View on Cabot’s valuation
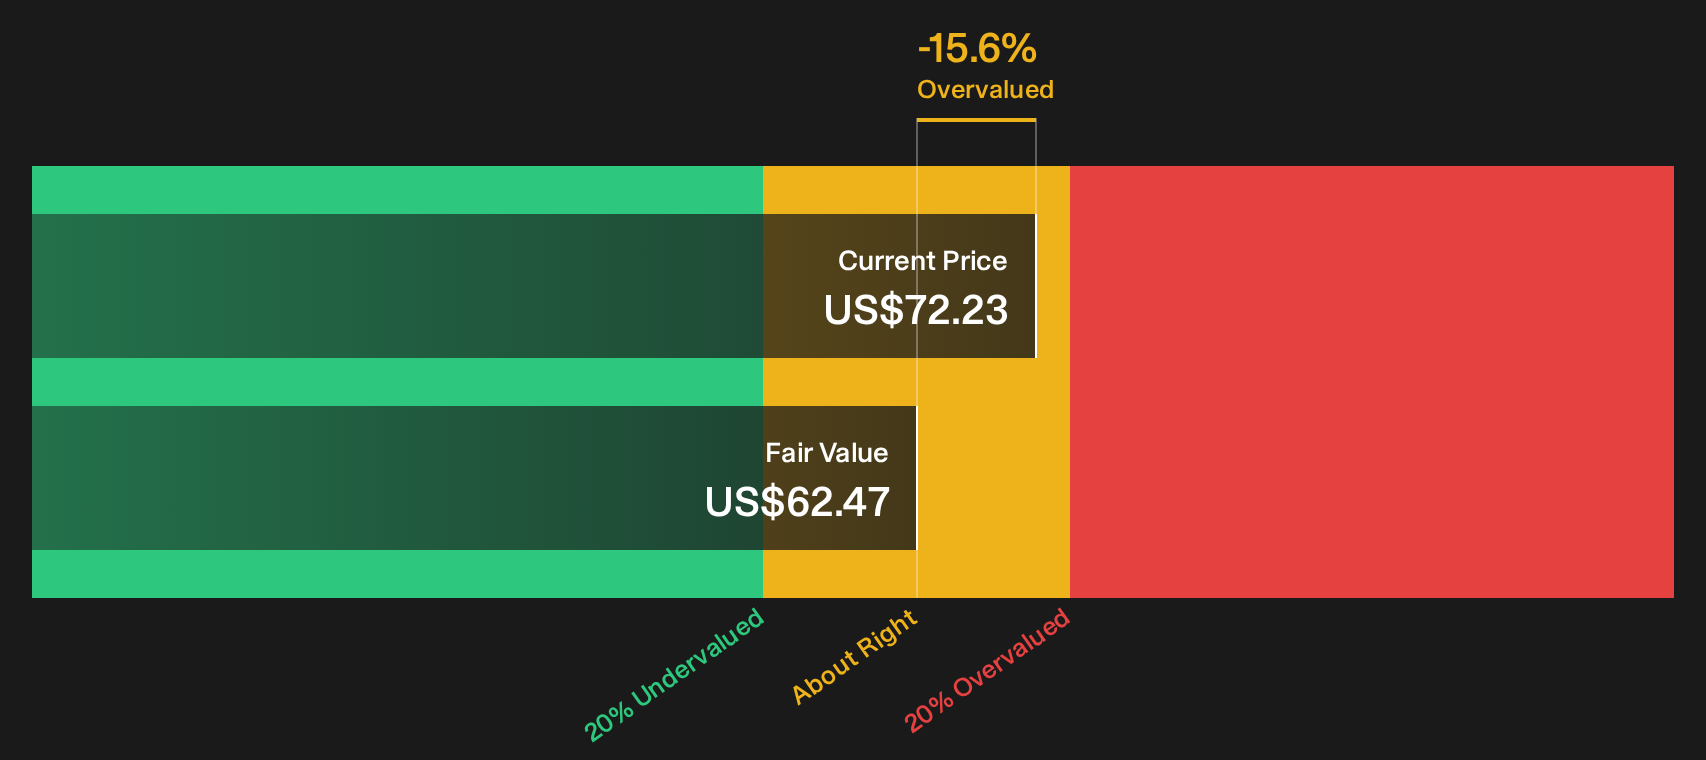
The analyst narrative presents Cabot as 18% undervalued at a fair value of $88.50, yet Simply Wall St’s DCF model points the other way. On that cash flow view, Cabot’s recent price of $72.23 sits above an intrinsic value estimate of $62.47, which implies a premium rather than a discount. That gap raises a simple question for you as an investor: do you place more weight on earnings-based targets, or on cash flows anchored in the SWS DCF model?
For a closer look at how the cash flow inputs and discount rate shape that $62.47 figure, and how sensitive it is to different assumptions, Look into how the SWS DCF model arrives at its fair value.
Simply Wall St performs a discounted cash flow (DCF) on every stock in the world every day (check out Cabot for example). We show the entire calculation in full. You can track the result in your watchlist or portfolio and be alerted when this changes, or use our stock screener to discover 32 high quality undervalued stocks. If you save a screener we even alert you when new companies match - so you never miss a potential opportunity.
Next Steps
Mixed signals on Cabot's value story align with the latest figures and share price movements, so consider acting promptly, reviewing the data for yourself, and weighing both 4 key rewards and 3 important warning signs.
Looking for more investment ideas beyond Cabot?
If Cabot has your attention, do not stop your research here. The same toolkit can help you compare stronger balance sheets, steadier income streams, and under-the-radar opportunities.
- Target resilience first by scanning a 30 resilient stocks with low risk scores that highlights businesses aiming for sturdier fundamentals and lower overall risk profiles.
- Pinpoint potential mispricing by reviewing a 32 high quality undervalued stocks that focuses on companies combining solid cash flows with balance sheets that support those earnings.
- Strengthen your income plan by checking a 6 dividend fortresses built around higher yield payments that may complement your existing holdings.
Have feedback on this article? Concerned about the content? Get in touch with us directly. Alternatively, email editorial-team@simplywallst.com