
MasterBrand (MBC) After Q3 Loss And Fresh Guidance, Is The Valuation Case Still Intact?
MasterBrand (MBC) has come under fresh scrutiny after third quarter results showed sales of US$1,036.8 million and a net loss of US$9.2 million, along with new fourth quarter net sales guidance.
That fresh guidance landed against a weak share price backdrop for MasterBrand. The stock has fallen 41.22% on a year to date share price basis and the 1 year total shareholder return is down 37.22%. However, a 3.11% 30 day share price gain hints at some stabilising momentum as investors react to the third quarter loss and new fourth quarter sales outlook.
Spot fresh ideas by comparing MasterBrand's recent setback and guidance with our hand picked 32 high quality undervalued stocks, which pair stronger balance sheets with more resilient share price trends.Recent trading around MasterBrand appears divided, with some investors reacting to the move into a loss and others concentrating on the broader sales picture. Is the latest share move driven by fundamentals or by shifts in sentiment, and what might that imply for valuation from here?
Preferred Price-to-Sales Multiple of 0.4x: Is it justified?
Valuation for MasterBrand currently hinges on how investors read its Price-to-Sales ratio of 0.4x next to a share price of $6.63 and an unprofitable bottom line. The market is weighing that low sales multiple against a history of losses and recent guidance, which creates a mixed message for anyone trying to value the stock.
The P/S ratio compares the value the market places on a company to its annual revenue rather than its earnings, which is especially relevant when a business is loss making. For a cabinet manufacturer like MasterBrand, where sales are sizable but net income is negative, this metric helps you judge what investors are willing to pay for every dollar of the top line.
Against peers, the gap is wide. MasterBrand trades on a P/S of 0.4x, while the US Building industry averages 1.8x. The stock is also framed as good value relative to peers in its own group. In addition, the estimated fair P/S ratio is 1.4x, which is substantially higher than where the market currently prices the shares and indicates a level sentiment could potentially migrate toward if views on the business shift.
Explore the SWS fair ratio for MasterBrand.
Result: Price-to-Sales of 0.4x (UNDERVALUED).
Still, the MasterBrand story carries real risk if cabinet demand in the US housing and remodeling markets softens further or losses deepen from current levels.
Find out about the key risks to this MasterBrand narrative.
Another View: Our DCF Model Paints A Different Picture
The P/S of 0.4x makes MasterBrand look inexpensive on sales, yet our DCF model indicates a very different picture. On that cash flow view, an estimated value of $2.60 per share is well below the current $6.63 price, which suggests potential overvaluation and raises the question of which signal may be more informative.
Look into how the SWS DCF model arrives at its fair value.
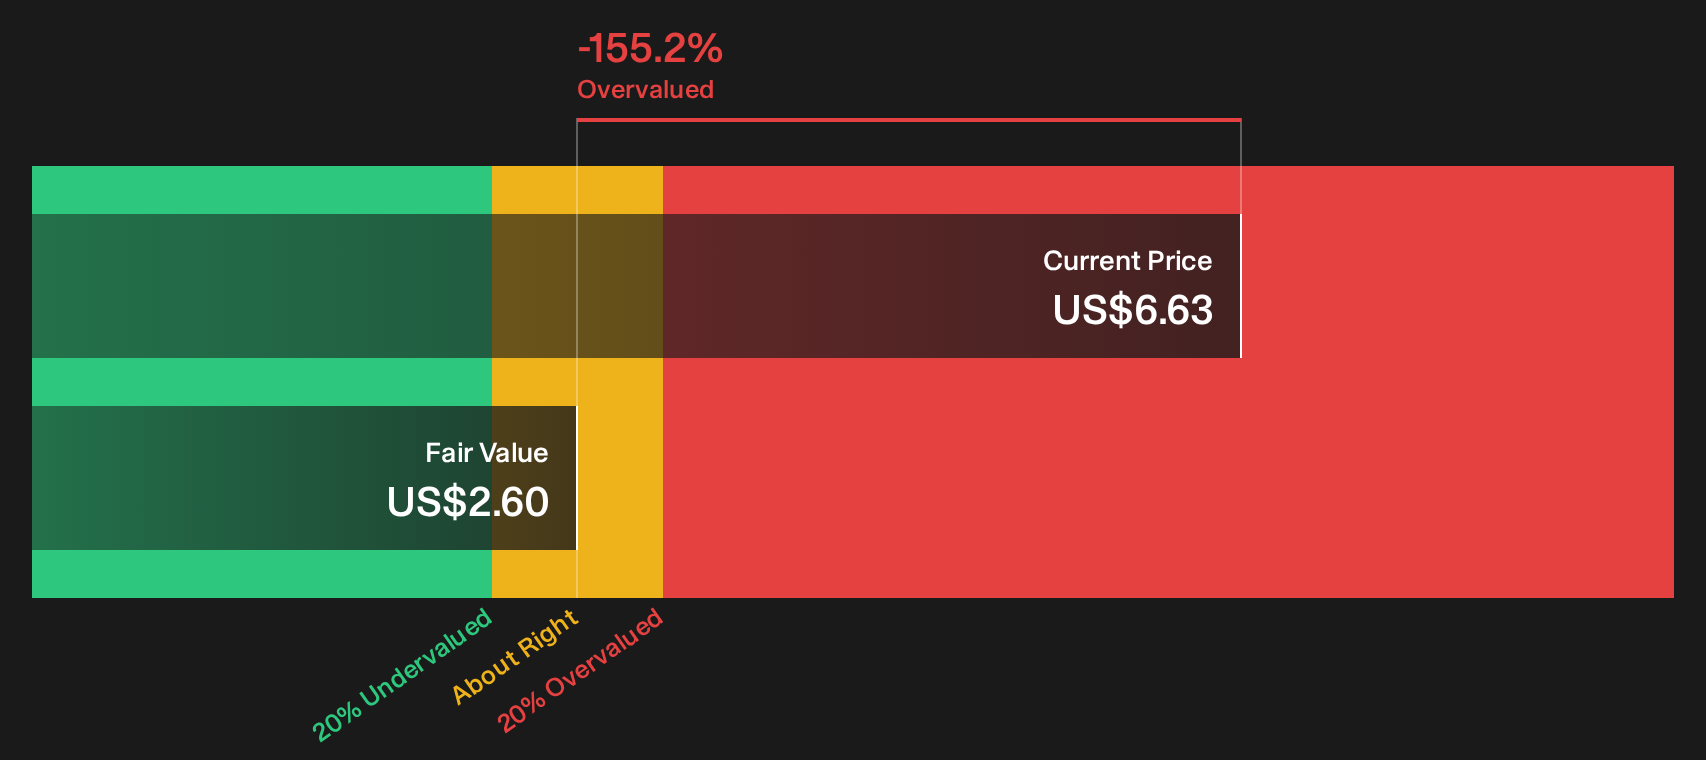
Simply Wall St performs a discounted cash flow (DCF) on every stock in the world every day (check out MasterBrand for example). We show the entire calculation in full. You can track the result in your watchlist or portfolio and be alerted when this changes, or use our stock screener to discover 32 high quality undervalued stocks. If you save a screener we even alert you when new companies match - so you never miss a potential opportunity.
Next Steps
Mixed signals around MasterBrand can leave the picture feeling blurred, so act while the data is fresh and decide where you stand based on the full set of 2 key rewards and 3 important warning signs
Looking for more MasterBrand sized investment ideas?
Do not stop your research with MasterBrand. Use the Simply Wall Street screener to hunt for other stocks that better match your risk tolerance and goals.
- Target potential mispricings by scanning companies that combine lower valuations with stronger business profiles through the 32 high quality undervalued stocks.
- Prioritise staying power by reviewing a list of solid balance sheet and fundamentals (23 results) that can better withstand tougher conditions and funding pressures.
- Hunt for off the radar opportunities by checking a 19 high quality undiscovered gems that already show healthy fundamentals before wider attention arrives.
Have feedback on this article? Concerned about the content? Get in touch with us directly. Alternatively, email editorial-team@simplywallst.com