
XPO (XPO) Posted Strong Q3 Earnings, Is 16% Undervalued Enough To Matter?
XPO (XPO) shares are back in focus after the freight transportation company released third quarter 2026 results, reporting higher sales, net income and earnings per share compared with the same period a year earlier.
Recent trading shows that XPO shares have given investors a mixed ride, with the share price rising 4.7% over the past month but declining about 10% across the last quarter. At the same time, the 1-year total shareholder return of 34.5% and 3-year total shareholder return of about 120.6% point to strong longer term momentum that this latest earnings update could help reinforce.
See how XPO compares with other freight and logistics stocks that have shown strong recent price and earnings momentum by using our curated list of 32 high quality undervalued stocks.
Bulls point to XPO's sharp earnings progress and long term share gains. Bears focus on the recent pullback and question how much good news is already priced in. Which story do the current valuation markers support?
Most Popular Narrative: 16% Undervalued
Against XPO’s last close at $189, the analyst consensus Narrative on Simply Wall St anchors fair value at about $225, which frames the debate around whether the recent earnings strength and freight data fully explain that gap.
The main factor that has to go right is that XPO continues to convert higher productivity, tighter LTL capacity, and a richer mix of local and premium shipments into sustained free cash flow generation and balance sheet strength.
The current valuation suggests that the market has not fully priced in the view that XPO is undervalued relative to its record profitability, rising free cash flow, and improving leverage profile.
See why 12 investors see XPO as 16% undervalued.
Result: Fair Value of $225.04 (UNDERVALUED)
Still, the XPO story can be knocked off course if freight demand softens again or if rising driver and labor costs eat into margins faster than efficiency gains.
Find out about the key risks to this XPO narrative.
Another View: What XPO’s P/E Is Telling You
The first fair value marker for XPO leans on future cash flows and implies the shares are trading at a discount. The picture looks very different when you zoom in on earnings multiples.
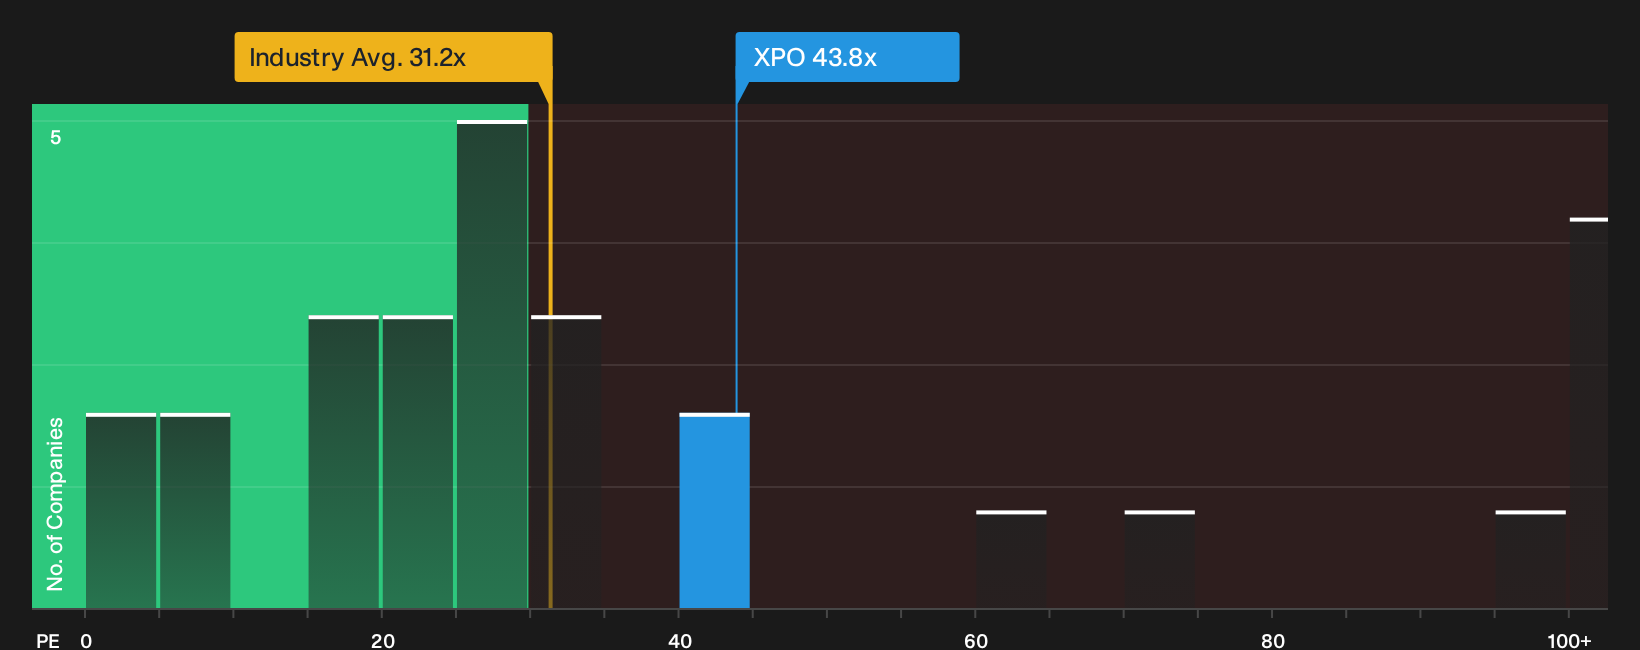
On a P/E of 43.8x, XPO trades far above the US Transportation industry at 30.9x and beyond the peer group average of 28.2x. It also sits at roughly double the fair ratio of 21.6x that Simply Wall St’s model suggests the market could move toward over time.
That kind of gap points to real valuation risk if sentiment cools, because a shift even partway toward the fair ratio would mean a much lower earnings multiple on the same profit base. The question for investors is simple: Which signal carries more weight for you right now, the discounted cash flow story or this rich P/E?
See what the numbers say about this price — find out in our valuation breakdown.
Next Steps
Mixed signals on XPO's valuation can feel confusing. Check the numbers yourself, weigh the potential upside against the weak spots, then review the 3 key rewards and 1 important warning sign
Looking for more XPO style investment ideas?
If XPO has sharpened your appetite for opportunities, do not stop at one ticker. Broaden your watchlist with focused stock ideas that match different goals.
- Target potential mispricing and seek companies combining quality with value by scanning our curated set of 32 high quality undervalued stocks.
- Strengthen your income stream and look for payout consistency by reviewing a hand picked group of 6 dividend fortresses.
- Prioritise resilience and protect against shocks by filtering for companies in our 30 resilient stocks with low risk scores.
Have feedback on this article? Concerned about the content? Get in touch with us directly. Alternatively, email editorial-team@simplywallst.com