
General American Investors Company (GAM) Declares Annual Dividend On A Valuation That Looks Cheap
Dividend announcement and why it matters
General American Investors Company (GAM) has declared an annual dividend of US$7.43 per share, payable on December 30, 2026, with both the ex dividend and record dates set for November 16, 2026.
The dividend news comes after a year in which General American Investors Company’s share price return is up 11.85% year to date. The 1 year total shareholder return of 14.89% and 5 year total shareholder return of 103.11% indicate momentum that has cooled slightly in recent months, as the 90 day share price return fell 2.94%, even though the stock has edged higher in the last week and month.
Scan income focused opportunities that mirror the latest payout momentum of General American Investors Company by reviewing our curated list of 6 dividend fortresses
Recent gains, a softer 90 day patch and a sizable dividend leave General American Investors Company looking interesting today. Does it make more sense to commit at this price or wait for a cheaper entry before the next move in valuation?
Preferred P/E of 4.3x: Is it justified?
On Simply Wall St's numbers, General American Investors Company is trading on a P/E of 4.3x while the shares last closed at $65.79. This puts the stock on a far lower multiple than many peers in the US Capital Markets space.
The P/E ratio compares the current share price with earnings per share and provides a quick shorthand for how much investors are currently paying for each dollar of profit. For an investment manager like General American Investors Company, that matters because earnings can swing with market conditions, so a low headline multiple does not always tell the full story.
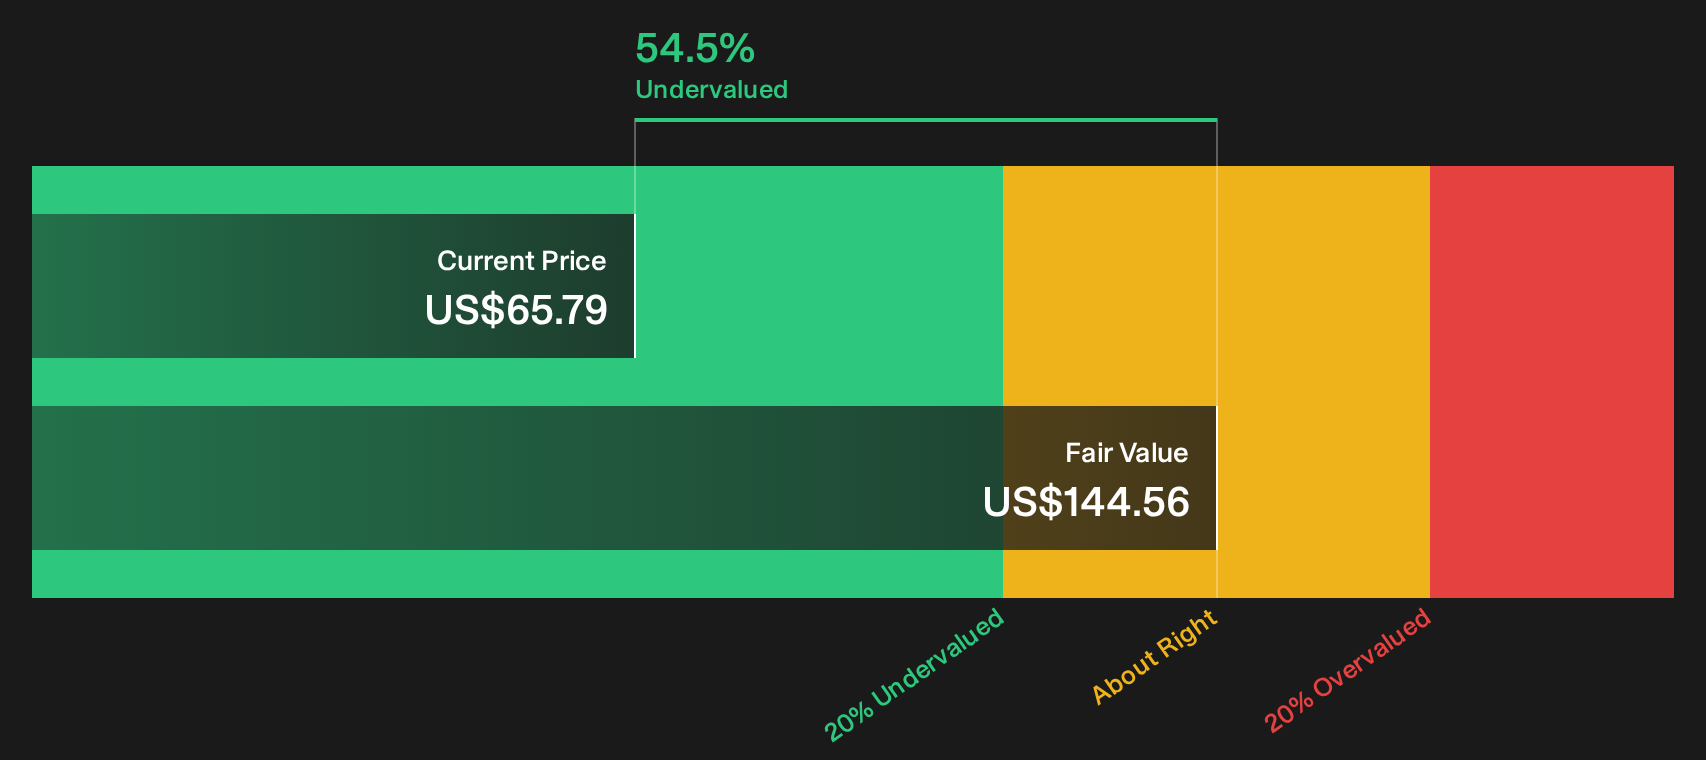
GAM's 4.3x P/E is materially below both the US Capital Markets industry average of 36.3x and a peer average of 20.3x. Those gaps suggest the market is assigning a steep discount to the business compared to similar stocks, even though Simply Wall St's DCF work indicates the shares are trading at a 54.5% discount to its estimate of future cash flow value of $144.56.
See what the numbers say about this price — find out in our valuation breakdown.
Result: Price-to-earnings of 4.3x (UNDERVALUED)
Still, the thesis around General American Investors Company can weaken if portfolio earnings soften or if the wide discount simply reflects persistent structural issues.
Find out about the key risks to this General American Investors Company narrative.
Another view on General American Investors Company’s value
The low 4.3x P/E paints General American Investors Company as deeply discounted. A different lens comes from Simply Wall St's DCF work, which estimates future cash flow value at $144.56 per share versus a $65.79 price, implying the stock trades at a steep markdown. Is that a genuine mispricing or just optimistic modeling?
Look into how the SWS DCF model arrives at its fair value.
Simply Wall St performs a discounted cash flow (DCF) on every stock in the world every day (check out General American Investors Company for example). We show the entire calculation in full. You can track the result in your watchlist or portfolio and be alerted when this changes, or use our stock screener to discover 32 high quality undervalued stocks. If you save a screener we even alert you when new companies match - so you never miss a potential opportunity.
Next Steps
If this mix of discount signals and dividend strength from General American Investors Company leaves you torn, that is the right instinct. Act while the numbers are fresh and pressure test the thesis from both angles by checking the 2 key rewards and 2 important warning signs
Looking for more investment ideas beyond General American Investors Company?
Do not stop at a single ticker. Broaden your watchlist with focused stock ideas so you are not relying on just one source of returns.
- Target stability with 30 resilient stocks with low risk scores that aim to keep portfolio swings in check when markets turn choppy.
- Hunt for quality bargains through the 32 high quality undervalued stocks that pair solid fundamentals with prices that lag underlying business strength.
- Spot tomorrow's potential standouts early by scanning the 19 high quality undiscovered gems before the wider market catches on.
Have feedback on this article? Concerned about the content? Get in touch with us directly. Alternatively, email editorial-team@simplywallst.com