
What Interface (TILE)'s Sales Outlook Cut Means For Shareholders
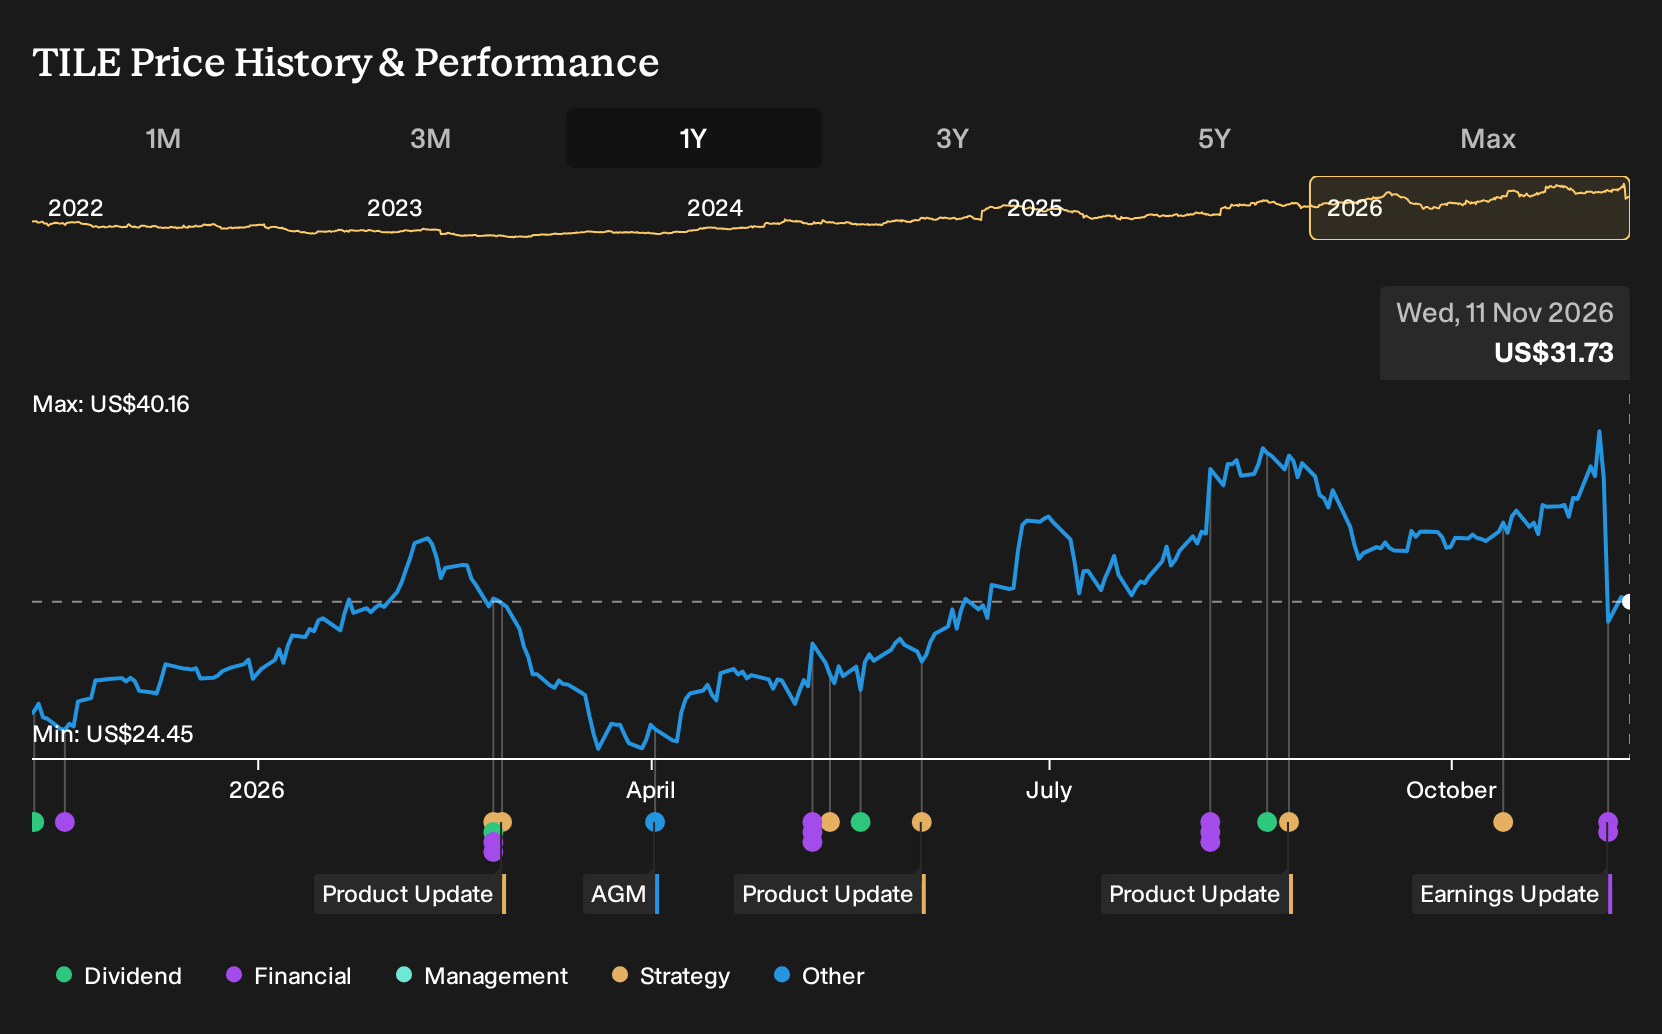
- Interface, Inc. cut its full year 2026 net sales outlook to a range of US$1.440b to US$1.455b from US$1.455b to US$1.485b, while reaffirming earnings guidance and citing softer demand in Europe.
- The company reported third quarter 2026 net income of US$39.22 million compared with US$46.15 million a year earlier, which contrasts with higher net income over the first nine months and puts more attention on how regional demand and pricing mix are affecting profitability on a quarter-by-quarter basis.
- Next, we examine how Interface's lower sales outlook tied to Europe might influence the longer term investment narrative.
Scan beyond Interface to see how other companies with resilient earnings or sales resets are lining up in the 19 high quality undiscovered gems.
Interface Investment Narrative Recap
For an investor to stay with Interface, the key belief is that the One Interface model, automation program and sustainability focus can keep margins healthy even when demand is uneven. The lowered 2026 sales outlook points to softer European conditions, but reaffirmed earnings guidance suggests that cost work and mix still matter more to near-term profit. The main short-term catalyst is continued margin delivery.
The biggest near-term risk is that weaker European orders combine with tariff headwinds and elevated expectations from the past year’s share price gains. If future quarters show softer orders or pricing that undercuts margin gains, the analyst consensus Narrative on Simply Wall St around earnings and valuation support could be challenged.
The most relevant piece of news here is the third quarter 2026 earnings release. Interface reported US$366.74 million in quarterly sales, slightly above the prior year, but net income of US$39.22 million compared with US$46.15 million. That mix of modest top-line progress and lower quarterly profit highlights how sensitive the story is to regional demand and product mix.
Over the first nine months of 2026, Interface reported US$1,093.47 million in sales and US$114.24 million in net income, both above the prior-year period. That context matters for catalysts, as it shows the business converting the One Interface model and automation work into higher year-to-date earnings, even as near-term risks concentrate in Europe and on how tariffs and pricing affect future quarters.
Interface's narrative projects US$1.7b revenue and US$157.1 million earnings by 2029. This assumes 5.9% yearly revenue growth and an earnings increase of about US$11.5 million from US$145.6 million today.
Explore how Interface's fair value reflects a potential 43% increase from its current price before other investors respond to this information.
Exploring Other Perspectives
One point the more pessimistic analysts keep circling is slower new product traction. Before this guidance cut, that group was only baking in about 2.6% annual revenue growth to roughly US$1.6b by 2029 and earnings of US$166.1 million. Those expectations already sat below the consensus tone, so this latest Interface update may push forecasts around again.
Explore 2 other Interface fair value estimates, including one that suggests it could be worth just $40.00!
Form Your Own Verdict
Don't just follow the ticker; dig into the data and build a conviction that's truly your own.
- A great starting point for your Interface research is our analysis highlighting 5 key rewards and 1 important warning sign that could impact your investment decision.
- See our latest analysis for Interface. The report includes a comprehensive fundamental analysis summarized in a single visual, the Snowflake, making it easy to evaluate Interface's overall financial health at a glance.
Looking For More Investment Ideas Beyond Interface?
Once you have a handle on Interface, it can help to widen the lens and compare it with other listed businesses that share some of the traits you care about most, whether that is value, resilience, or reliable income.
- For investors who want quality at a price that still looks reasonable based on fundamentals, start by scanning the 32 high quality undervalued stocks and see which companies line up with your return and risk preferences.
- If capital preservation matters as much as upside, review the 30 resilient stocks with low risk scores to focus on businesses screened for more resilient balance sheets and milder risk scores.
- For those who like the combination of cash returns and staying power, use the 6 dividend fortresses to narrow in on higher yielding stocks that still clear financial health checks.
Have feedback on this article? Concerned about the content? Get in touch with us directly. Alternatively, email editorial-team@simplywallst.com