
American Financial Group (AFG) Reports Higher Earnings And A Special Dividend, Is It Fully Valued?
Why American Financial Group is in focus after its latest update
American Financial Group (AFG) is back on investor watch after third quarter and year to date earnings, paired with a fresh special dividend announcement, reshaped the near term income and performance picture.
Recent trading reflects that update. American Financial Group’s share price return is up 4.15% over the past week and 12.11% over the past month. Its 1 year total shareholder return of 19.56% and 3 year total shareholder return of 72.29% point to momentum that has been building over time.
Scan how American Financial Group compares with other insurers returning cash to shareholders by checking our curated 6 dividend fortresses alongside this latest special payout story.
Bulls point to American Financial Group’s stronger recent earnings and special dividend as proof the latest rally still has room to run. Bears see a rich share price and question how much of that is already baked in. Which side does the current valuation support?
Most Popular Narrative: 3% Overvalued
American Financial Group last closed at $161.19, slightly above the analyst consensus Narrative fair value of $155.83. This anchors the current debate around how much future profit and capital returns are already reflected in the price. The analyst consensus Narrative on Simply Wall St ties that fair value to a detailed view of underwriting trends, investment yields and balance sheet use rather than a single short term catalyst.
The main factor is that American Financial Group continues to produce attractive combined ratios in specialty lines, including social inflation exposed casualty and commercial auto, while sustaining productive use of excess capital and expanding AI driven efficiency gains.
The current valuation implies that investors are not fully pricing in this mix of underwriting profitability, sizeable capital returns and higher yielding reinvestment, so the share price may leave room for a more positive outcome than the market is assuming.
See why 14 investors see American Financial Group as 3% overvalued.
Result: Fair Value of $155.83 (OVERVALUED)
Still, the narrative can crack if alternative investment returns stay weak or if social inflation exposed lines continue to pressure loss ratios and reserve releases.
Find out about the key risks to this American Financial Group narrative.
Another View: American Financial Group Through A Cash Flow Lens
Price based on earnings multiples tells one story. The SWS DCF model tells a different one. At a share price of $161.19, American Financial Group is described as trading about 43.8% below an estimated future cash flow value of $286.80, which paints it as undervalued rather than rich.
This kind of gap raises a practical question for investors. Is the market correctly discounting AFG's cash generation, or are earnings based measures missing something important in how this insurer converts premiums and investments into long term value?
Look into how the SWS DCF model arrives at its fair value.
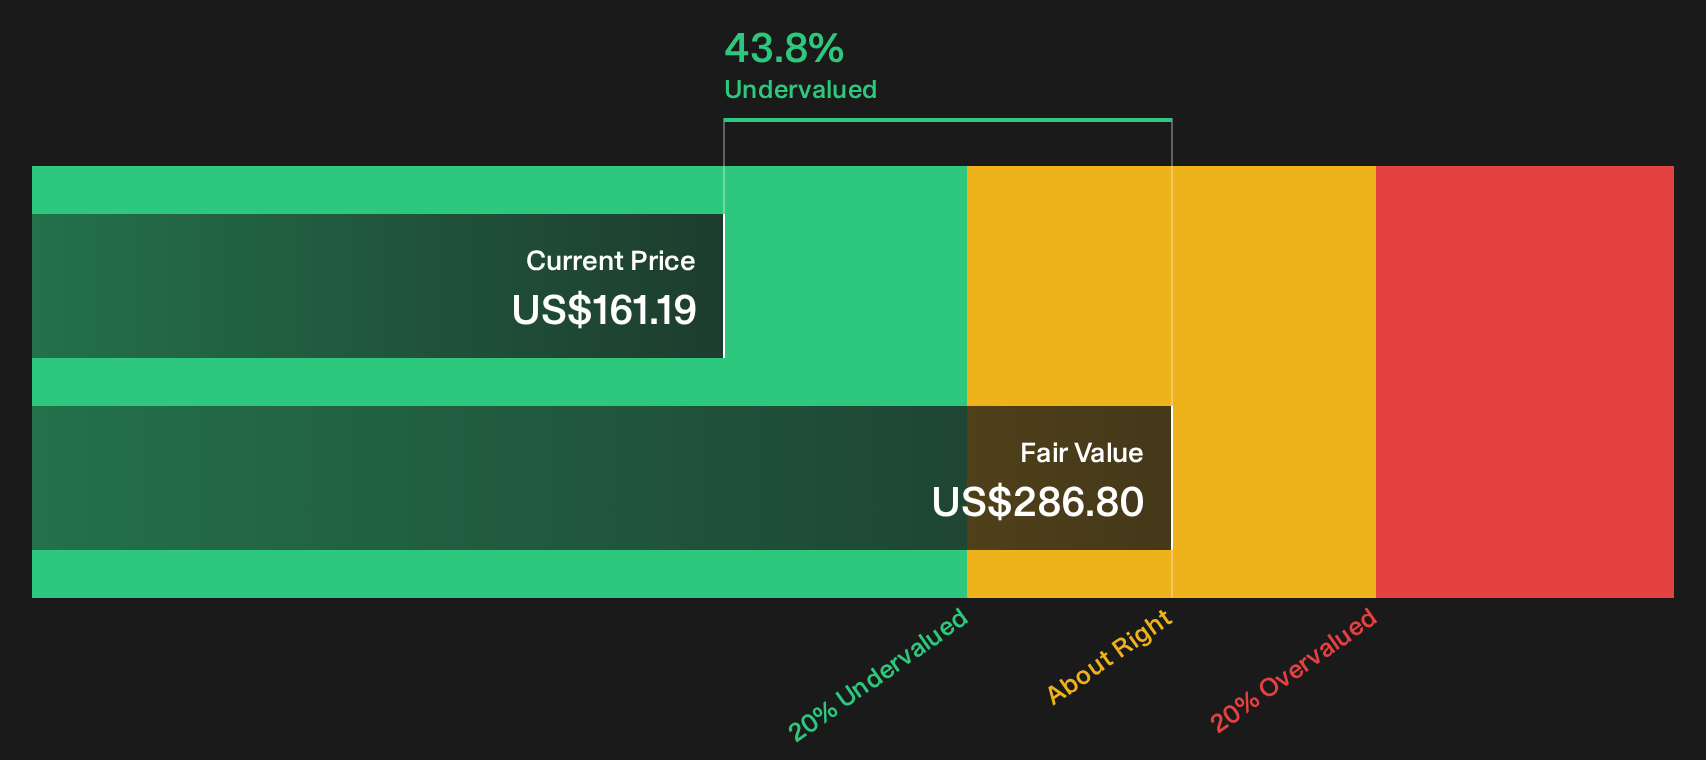
Simply Wall St performs a discounted cash flow (DCF) on every stock in the world every day (check out American Financial Group for example). We show the entire calculation in full. You can track the result in your watchlist or portfolio and be alerted when this changes, or use our stock screener to discover 32 high quality undervalued stocks. If you save a screener we even alert you when new companies match - so you never miss a potential opportunity.
Next Steps
Sentiment around American Financial Group is mixed, with income appeal pulling one way and valuation questions pulling the other. Move quickly and weigh the signals for yourself by reviewing the 2 key rewards and 2 important warning signs
Looking for more investment ideas beyond American Financial Group?
If American Financial Group has your attention, do not stop here. Use Simply Wall Street's tools to pressure test your next move and widen your opportunity set.
- Target stability first by scanning a list of solid balance sheet and fundamentals (23 results) that can help you focus on businesses with cleaner finances when markets turn choppy.
- Hunt for mispriced quality with the 32 high quality undervalued stocks and see which companies the data suggests might be trading below their fundamentals.
- Build your income short list by checking a 6 dividend fortresses that highlights high yielders while still accounting for balance sheet strength.
Have feedback on this article? Concerned about the content? Get in touch with us directly. Alternatively, email editorial-team@simplywallst.com