
Lumine Group (TSXV:LMN) Revenue Jumped, Is The Stock Fully Priced?
Why Lumine Group’s Latest Earnings Matter For Investors
Lumine Group (TSXV:LMN) just posted third quarter 2026 results that combined sharply higher revenue with relatively stable quarterly profit, a mix that put margin trends and cash generation in sharper focus for shareholders.
Recent trading has been choppy for Lumine Group. The share price is up 20.92% over the past month and 11.08% over the last 90 days, while the 1-year total shareholder return of 12.68% suggests longer term holders have seen steadier gains than short term traders.
Capitalize on the attention around Lumine Group’s earnings and scan a hand-picked 6 high quality undervalued stocks that share a mix of growth, profitability, and potentially mispriced valuations.The jump in Lumine Group’s share price came while nine month profit trailed the prior year, which leaves a simple tension for investors. Does the current valuation still reward fresh buyers for taking that earnings risk?
Price-to-Earnings of 45.1x: Is it justified?
Lumine Group closed at CA$27.46 while trading on a P/E of 45.1x, and that figure immediately signals that the market is paying a premium for each dollar of current earnings.
The P/E ratio compares the share price with net profit per share and is a common shorthand for how heavily investors are valuing a company’s earnings stream. For a software-focused group like Lumine Group, a higher multiple often reflects expectations for continued growth and relatively resilient profitability rather than asset backing.
Here, the current 45.1x P/E sits well above the North American Software industry average of 32.7x and above the peer average of 37.7x. It also exceeds an estimated fair P/E of 31.1x, which is the level our models suggest the market could move toward if sentiment and growth expectations return to more typical levels.
Explore the SWS fair ratio for Lumine Group.
Result: Price-to-Earnings of 45.1x (OVERVALUED)
Still, Lumine Group’s premium P/E could come under pressure if its profit growth slows, or if investor focus swings away from higher multiple software stocks.
Find out about the key risks to this Lumine Group narrative.
Another View On Lumine Group’s Value
The P/E screen paints Lumine Group as expensive, yet the SWS DCF model points the other way. At CA$27.46, the stock is described as trading 43.3% below an estimated future cash flow value of CA$48.45, which suggests the market may be discounting its long term cash generation too heavily. Which signal do you treat as more important?
Look into how the SWS DCF model arrives at its fair value.
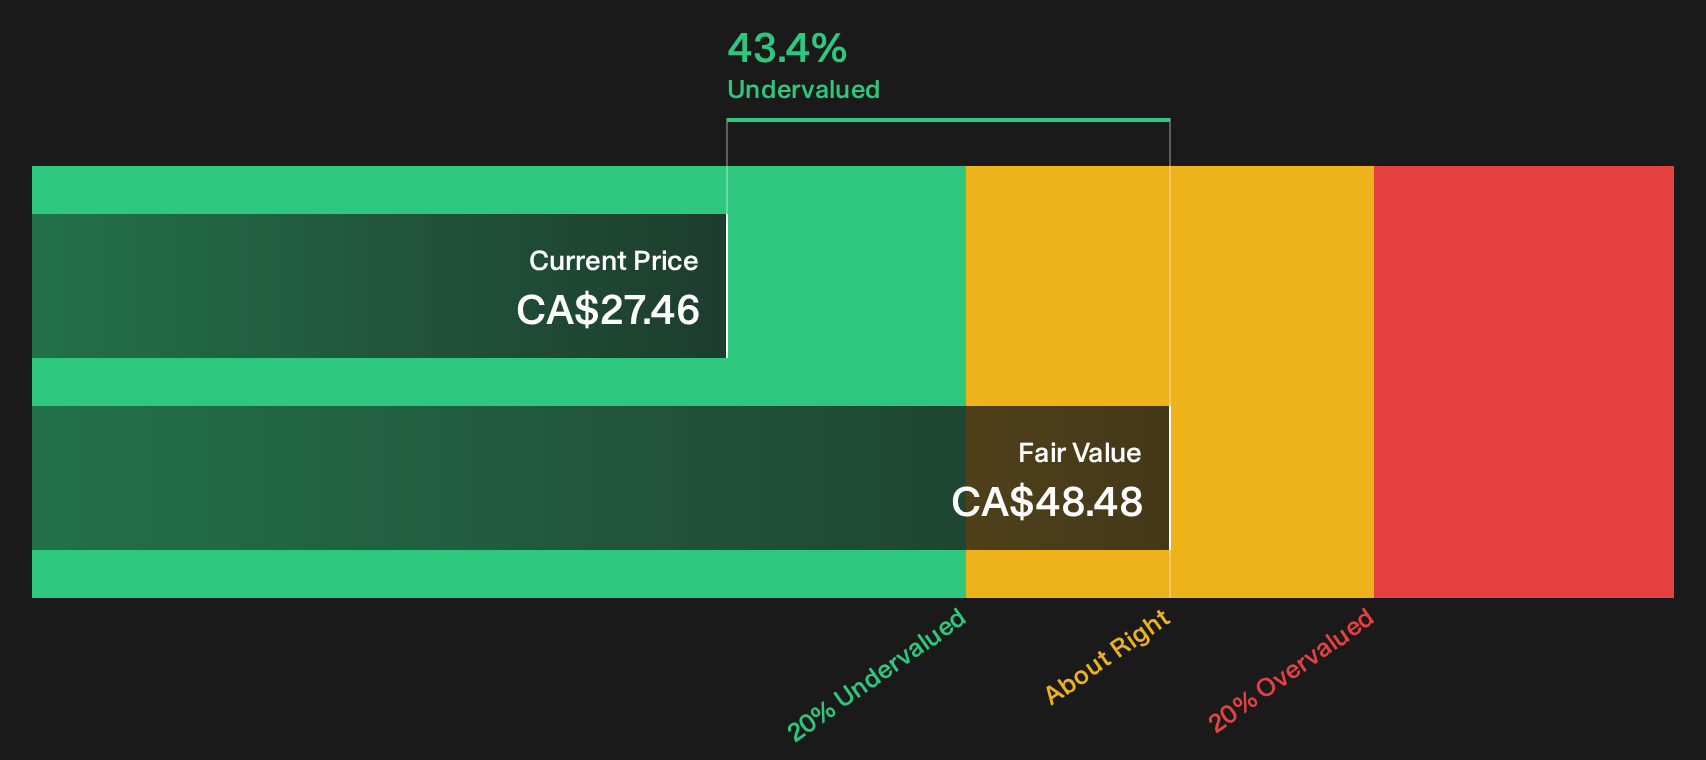
Simply Wall St performs a discounted cash flow (DCF) on every stock in the world every day (check out Lumine Group for example). We show the entire calculation in full. You can track the result in your watchlist or portfolio and be alerted when this changes, or use our stock screener to discover 6 high quality undervalued stocks. If you save a screener we even alert you when new companies match - so you never miss a potential opportunity.
Next Steps
Mixed signals on Lumine Group’s valuation do not need to leave you on the sidelines; you can review the data, move quickly, and stress test your own stance by weighing the 4 key rewards
Looking for more Lumine Group sized opportunities?
If Lumine Group is on your radar after these results, do not stop here. Fresh ideas often come from looking just one layer beyond your current watchlist.
- Target resilient balance sheets and steady fundamentals by scanning our list of solid balance sheet and fundamentals (6 results) to help anchor a more durable portfolio.
- Hunt for mispriced quality by reviewing the 6 high quality undervalued stocks that combine strong fundamentals with valuations the market may be overlooking.
- Lock in potential income streams by focusing on the 3 dividend fortresses that aim to pair higher yields with underlying financial strength.
Have feedback on this article? Concerned about the content? Get in touch with us directly. Alternatively, email editorial-team@simplywallst.com