
CBL & Associates Properties (CBL) Lifts Guidance And Adds Buyback, Is The Stock Overvalued?
CBL & Associates Properties (CBL) has drawn fresh attention after a cluster of announcements, including third quarter results, higher full year 2026 earnings guidance, and a new US$25 million share repurchase plan.
Recent trading suggests momentum has picked up for CBL & Associates Properties, with a 7-day share price return of 15.41% and a 30-day gain of 14.13%. The year-to-date share price return of 47.87% sits alongside a 1-year total shareholder return of 77.64% and a 3-year total shareholder return of almost 3x.
Scan how CBL & Associates Properties fits alongside other real estate and income-focused plays by comparing it with our handpicked 6 dividend fortresses.
After a near 48% year-to-date run and analyst targets sitting meaningfully higher than today’s US$54.61 price, where does fair value for CBL & Associates Properties really fall within that spread of estimates?
Price-to-Earnings of 11.2x: Is it justified?
On simple earnings terms, CBL & Associates Properties trades on a P/E of 11.2x, which is well below both the wider US market and its Retail REITs peer group. For readers, that sets up a key question around whether the current $54.61 share price reflects a discount or a signal that the market is pricing in weaker profit quality and future declines.
The P/E ratio compares the current share price with earnings per share. For a real estate investment trust such as CBL & Associates Properties, it can give a quick sense of how much investors are paying for each dollar of profit today. A lower P/E can hint that investors are cautious about the durability of those earnings or about the balance sheet that supports them.
Several factors feed into that caution. Management has reported a large one off gain of $61.7m that affects the last 12 months of results to 30 September 2026, and earnings are forecast to decline by an average of 83.8% per year over the next 3 years. Interest payments are also not well covered by earnings, and 100% of liabilities come from higher risk funding sources, which can make the current profit base look less robust when stacked against those headline valuation metrics.
The comparison with peers is stark. CBL & Associates Properties trades at a P/E that is below the US market average of 17.6x and far below the US Retail REITs industry average of 25.5x and a peer average of 35.8x. That gap is wide, and the estimated fair P/E of 9.6x points to a level the market could move towards if earnings quality concerns remain in focus.
Explore the SWS fair ratio for CBL & Associates Properties.
Result: Price-to-Earnings of 11.2x (ABOUT RIGHT)
Still, interest coverage pressure and the reliance on higher risk funding leave CBL & Associates Properties exposed if earnings forecasts or financing conditions deteriorate further.
Find out about the key risks to this CBL & Associates Properties narrative.
Another view on CBL & Associates Properties valuation
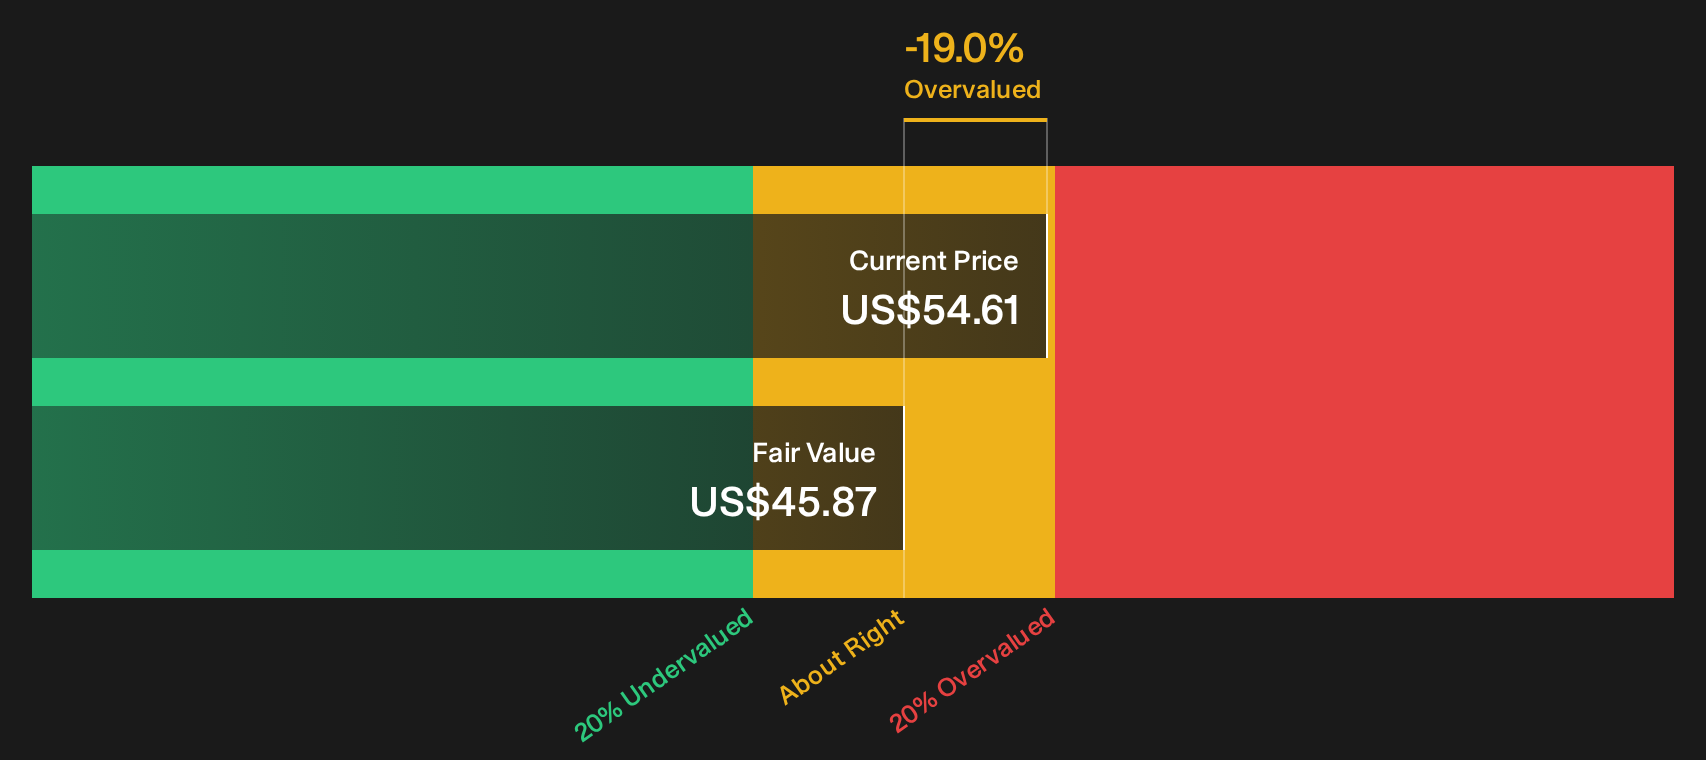
Look at CBL & Associates Properties through the SWS DCF model and the picture changes. On this approach, the estimated value of future cash flows sits at $45.87 per share, so the current $54.61 price screens as overvalued rather than cheap. Which signal matters more for you: earnings multiples or cash flow value?
Before leaning too hard on either lens, it helps to understand how the cash flow approach is built and what would need to change in the inputs for that $45.87 estimate to move closer to the market price. Look into how the SWS DCF model arrives at its fair value.
Simply Wall St performs a discounted cash flow (DCF) on every stock in the world every day (check out CBL & Associates Properties for example). We show the entire calculation in full. You can track the result in your watchlist or portfolio and be alerted when this changes, or use our stock screener to discover 32 high quality undervalued stocks. If you save a screener we even alert you when new companies match - so you never miss a potential opportunity.
Next Steps
Mixed about CBL & Associates Properties after all of that valuation noise and sentiment data. Act while the details are fresh and weigh the 2 key rewards and 4 important warning signs.
Looking for more investment ideas beyond CBL & Associates Properties?
Consider broadening your search beyond CBL & Associates Properties, as there may be other opportunities that align with your goals, particularly when you see how different filters can reshape your watchlist.
- Target higher quality at sensible prices by starting with companies that pass tight value and fundamentals checks through our 32 high quality undervalued stocks.
- Prioritise resilience by focusing on businesses with cleaner finances and stronger safety nets using the list of solid balance sheet and fundamentals (24 results).
- Boost potential portfolio income by screening for reliable payers and payout profiles with the 6 dividend fortresses.
Have feedback on this article? Concerned about the content? Get in touch with us directly. Alternatively, email editorial-team@simplywallst.com