
Sempra (SRE), What Is Behind The Latest Attention?
Sempra (SRE) just locked in a fresh catalyst for income-focused investors. The board declared a US$0.6575 quarterly dividend, payable on January 15, 2027, to shareholders of record on December 10, 2026.
Sempra shares trade at US$79.54 and the 1-year total shareholder return, which includes price moves and dividends, is down 10.94%. However, the 5-year total shareholder return of 51.55% points to stronger longer term compounding for patient holders.
Scan beyond Sempra and evaluate other income candidates with resilient balance sheets using our hand picked list of solid balance sheet and fundamentals (24 results) as your starting universe.
Sempra now offers a higher yield on a share price that has pulled back, which puts one decision in front of you. Does the current tag already reflect the recent news, or is patience worth more here than moving early?
Most Popular Narrative: 20% Undervalued
The analyst consensus Narrative on Simply Wall St sees Sempra worth about $99 based on its fair value estimate, compared with the recent $79.54 close. That gap reflects a view that today’s price does not fully capture the earnings and asset profile set out in the Narrative.
The US$47.5b five year base capital plan at Oncor, along with US$10b of incremental identified projects tied to ERCOT endorsed upgrades, reliability work and future resiliency filings, keeps the earlier thesis about sustained capital deployment into transmission and distribution assets in place as a driver of long term earnings growth.
See why 30 investors see Sempra as 20% undervalued.
Result: Fair Value of $99 (UNDERVALUED)
Still, Sempra’s story can break if regulators squeeze allowed returns in California or Texas, or if LNG construction setbacks drag on earnings longer than expected.
Find out about the key risks to this Sempra narrative.
Another View on Sempra’s Value
That fair value of $99 leans heavily on earnings forecasts and analyst targets. A different lens tells a cooler story. The SWS DCF model, which values Sempra by projecting and discounting future cash flows, lands closer to $45.55 per share, implying the stock trades well above that cash flow estimate. Which yardstick do you trust more when the signals point in opposite directions?
For a closer look at how that cash flow view is built, and what would need to change for it to line up with the analyst fair value, Look into how the SWS DCF model arrives at its fair value.
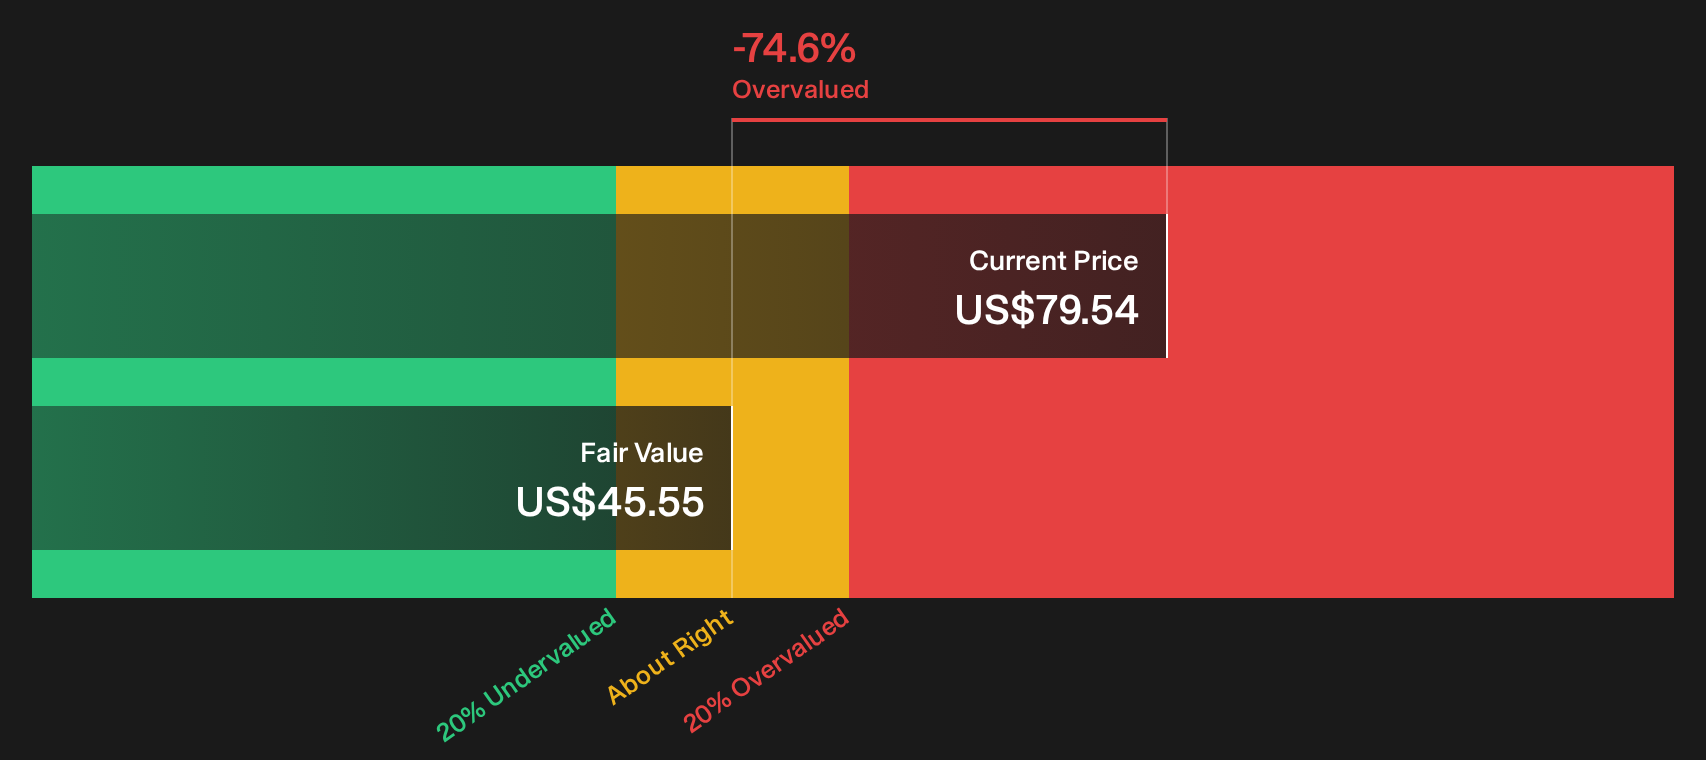
Simply Wall St performs a discounted cash flow (DCF) on every stock in the world every day (check out Sempra for example). We show the entire calculation in full. You can track the result in your watchlist or portfolio and be alerted when this changes, or use our stock screener to discover 32 high quality undervalued stocks. If you save a screener we even alert you when new companies match - so you never miss a potential opportunity.
Next Steps
Mixed signals on Sempra’s value and income story can feel uncomfortable, so move quickly to review the numbers, weigh the key trade offs, and pressure test both sides of the debate using the full picture of 5 key rewards and 2 important warning signs
Looking for more investment ideas beyond Sempra?
If Sempra has you thinking harder about income, value, and risk, do not stop here. Broaden your watchlist now so you are not reacting late.
- Target potential mispricing and hunt for quality at a discount with 32 high quality undervalued stocks.
- Build a steadier payout stream by focusing on companies that look like genuine income workhorses using the 6 dividend fortresses.
- Dial down potential shocks by concentrating on businesses that score well on resilience through the 31 resilient stocks with low risk scores.
Have feedback on this article? Concerned about the content? Get in touch with us directly. Alternatively, email editorial-team@simplywallst.com