
Rinnai (TSE:5947) On Mixed Half Year Results And New Guidance Looks About Right
Rinnai (TSE:5947) is back in focus after half year results showed higher sales alongside lower net income, paired with a small dividend increase and fresh guidance that could reset expectations.
Rinnai’s latest update lands after a mixed price run. The 7-day share price return of 4.11% and 1-month gain of 5.94% partly offset a year-to-date share price decline of 9.86%, while the 3-year total shareholder return of 30.12% points to momentum built over a longer horizon.
Seize this chance to compare Rinnai’s latest move with other quality businesses showing resilient performance and cleaner balance sheets through our hand picked list of solid balance sheet and fundamentals (24 results).Bulls point to Rinnai’s higher sales, rising dividend and guidance, while bears focus on the drop in net income. Which side looks closer to fair value once you run the numbers?
Preferred Price-to-Earnings of 14.6x: Is it justified?
Rinnai closed at ¥3,601, which equates to a P/E of 14.6x, and that level puts the stock in a tricky middle ground between discounted cash flow value, industry benchmarks, and peer comparisons.
The P/E ratio compares the current share price with earnings per share. For a manufacturer of thermal equipment with established operations in Japan, the United States, Australia, China, South Korea, Indonesia, and other markets, it is a simple way to see how much investors are currently paying for each unit of profit.
On one side of the ledger, the SWS DCF model flags Rinnai as trading at roughly 17.5% below its future cash flow value, with an estimated value of ¥4,362.24 against the ¥3,601 market price. On the other side, earnings growth over the past year of 2.4% sits below its own 5 year average of 7.8% per year and trails the Consumer Durables industry, while return on equity of 7.9% is described as low and profitability is expected to grow at 4.29% per year rather than at a fast clip.
Compared with the wider Consumer Durables industry, that 14.6x P/E is described as expensive versus an industry average of 10x, which suggests investors are paying a premium relative to the broader sector. Against a peer group though, the same 14.6x multiple is labelled good value versus an average of 17.8x, implying Rinnai trades at a discount to closer comparables even as its ratio sits only slightly above an estimated fair P/E of 14.5x that the market could eventually converge toward.
Explore the SWS fair ratio for Rinnai.
Result: Price-to-earnings of 14.6x (ABOUT RIGHT)
Still, weaker recent share price performance over one year and five years, along with a relatively low value score of 2, could challenge the current Rinnai thesis.
Find out about the key risks to this Rinnai narrative.
Another View: Rinnai Through The DCF Lens
The SWS DCF model paints a different picture for Rinnai. On this view, the equity trades at about a 17.5% discount to an estimated future cash flow value of ¥4,362.24 per share, compared with a market price of ¥3,601. Could the market be underpricing the company’s long haul cash generation?
Our DCF work is fully spelled out. You can see every assumption and adjust your own expectations against it through Look into how the SWS DCF model arrives at its fair value..
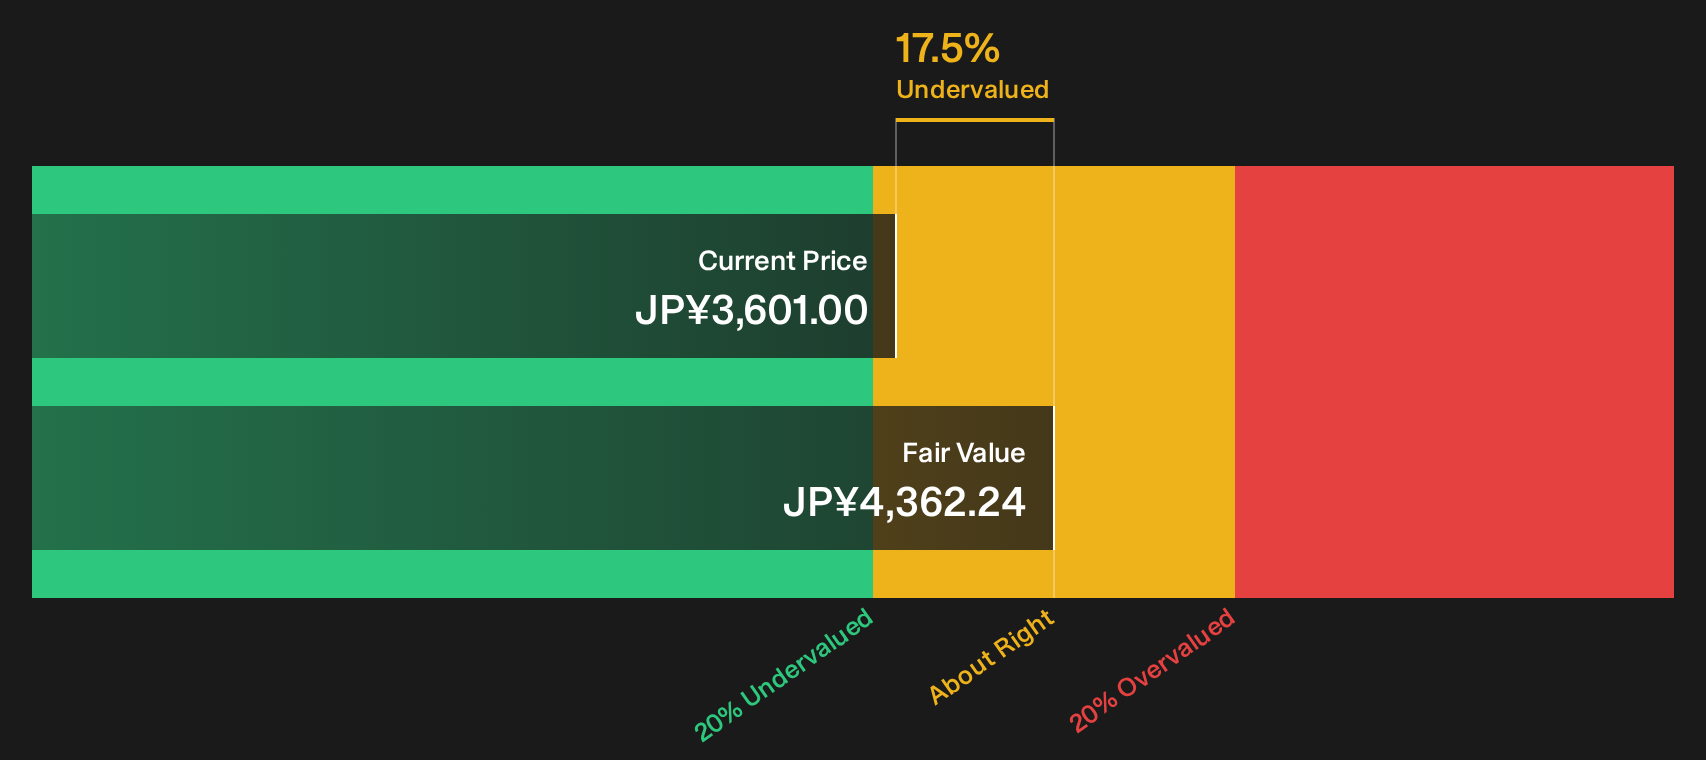
Simply Wall St performs a discounted cash flow (DCF) on every stock in the world every day (check out Rinnai for example). We show the entire calculation in full. You can track the result in your watchlist or portfolio and be alerted when this changes, or use our stock screener to discover 20 high quality undervalued stocks. If you save a screener we even alert you when new companies match - so you never miss a potential opportunity.
Next Steps
Mixed signals or quiet opportunity: either way, this is the moment to check the underlying data yourself and decide where you stand. To see what the optimism is built on, review the 4 key rewards.
Want more ideas beyond Rinnai?
If Rinnai sparked fresh questions about where to put capital to work next, let a few targeted screens help you spot opportunities you might otherwise miss.
- Target resilient return potential by focusing on companies with strong finances and low risk profiles through the 19 resilient stocks with low risk scores.
- Hunt for mispriced quality by zeroing in on companies that combine solid fundamentals with attractive valuations using the 73 high quality undiscovered gems.
- Lock in potential income streams by reviewing companies offering higher yields with supportive metrics across the 29 dividend fortresses.
Have feedback on this article? Concerned about the content? Get in touch with us directly. Alternatively, email editorial-team@simplywallst.com