
V.F (VFC) Shares Just Moved, So What Is Driving Attention Now?
V.F (VFC) just partnered with SAP on S.Fashion, an AI powered retail test store in Walldorf, giving investors a live look at how data driven automation might influence future consumer engagement.
That test store arrives at a moment when V.F shares have been rebuilding momentum, with a 30 day share price return of 22.73% and a 90 day share price return of 42.82%. The 1 year total shareholder return of 41.29% contrasts sharply with a 5 year total shareholder return that is down 67.86%, indicating a sharp rebound in recent sentiment from a much weaker long term experience.
Scan how other apparel and consumer brands are using AI, automation and data driven retail by reviewing our hand picked list of 53 AI infrastructure stocks alongside V.F.
After a 40% plus rebound over the past year, the question around V.F is simple: Does it make more sense to pay up today or wait for a cleaner entry on valuation grounds?
Most Popular Narrative: 3.2% Overvalued
V.F is trading at a last close of $20.68 compared with a fair value of $20.05 in the analyst consensus Narrative on Simply Wall St. This Narrative builds off revenue forecasts, earnings assumptions and a 10.1% discount rate.
The ongoing supply chain and inventory transformation, including tariff mitigation efforts, hedging, and AI enabled tools tested in the S.Fashion store and used for markdown and planning decisions, is intended to keep markdowns and discounting more controlled and to support further gross margin expansion and stronger free cash flow generation.
See why 49 investors see V.F as 3% overvalued.
Result: Fair Value of $20.05 (OVERVALUED)
Still, the V.F story can slip if the Vans recovery stalls again or if prolonged APAC weakness continues to weigh on group revenue and profitability.
Find out about the key risks to this V.F narrative.
Another View: Our DCF Says V.F Looks Cheap
Analysts on Simply Wall St see V.F as roughly fairly priced at $20.05, yet the SWS DCF model paints a very different picture. It estimates a future cash flow value of $31.07 per share, which is about 33% above the recent $20.68 price and flags a sizeable valuation gap for investors to weigh.
For readers who want to see how that gap is built up from cash flow forecasts, discount rates, and terminal assumptions, Look into how the SWS DCF model arrives at its fair value.
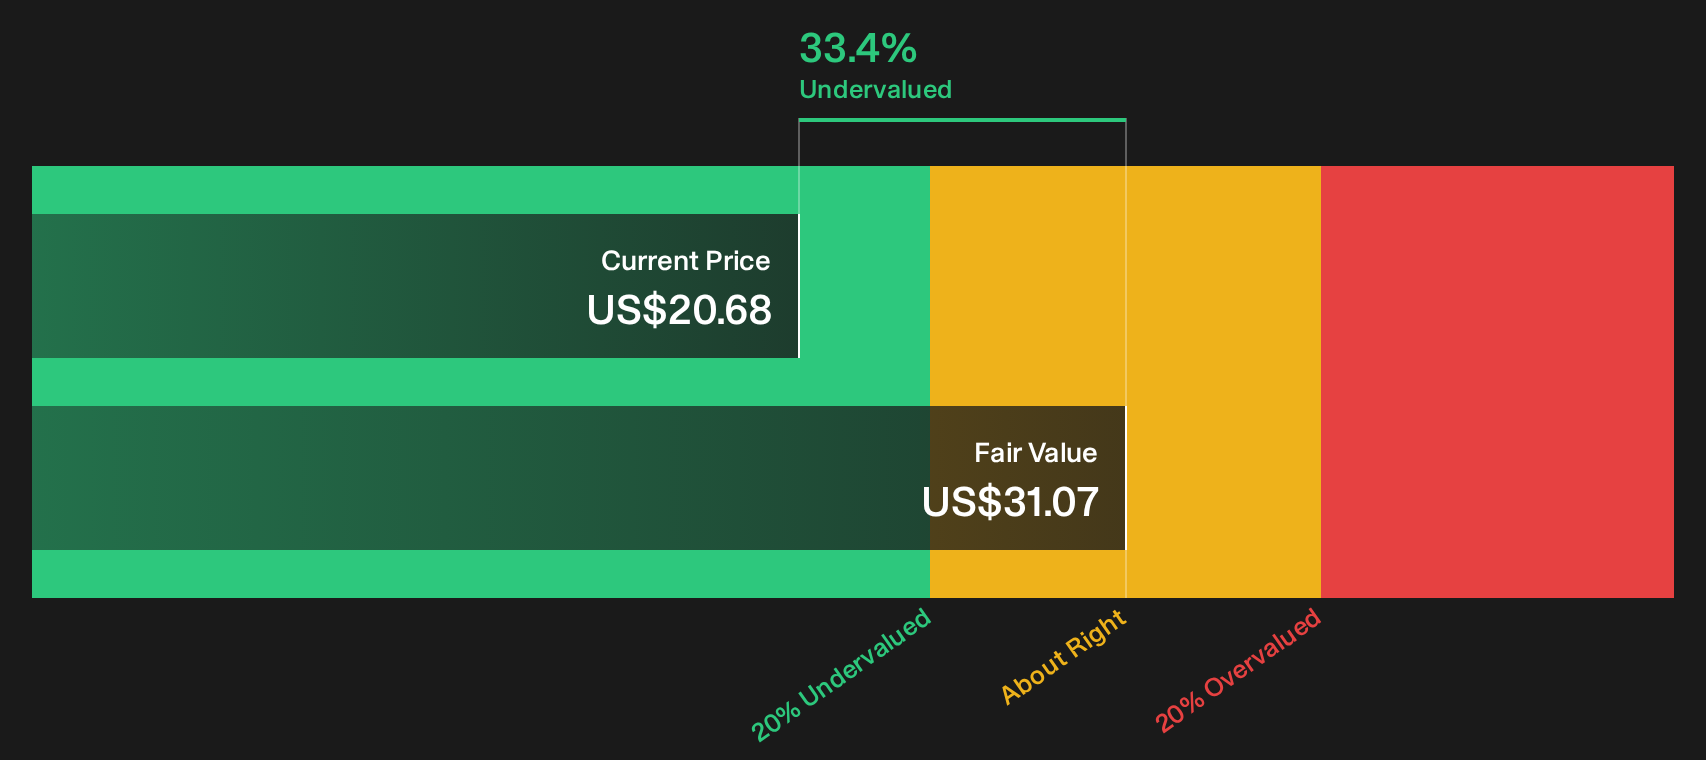
Simply Wall St performs a discounted cash flow (DCF) on every stock in the world every day (check out V.F for example). We show the entire calculation in full. You can track the result in your watchlist or portfolio and be alerted when this changes, or use our stock screener to discover 34 high quality undervalued stocks. If you save a screener we even alert you when new companies match - so you never miss a potential opportunity.
Next Steps
Sentiment around V.F is clearly split, with fresh optimism sitting beside a tough recent history. It therefore helps to move fast and check the full picture yourself. To weigh that balance directly, take a closer look at the 3 key rewards and 2 important warning signs.
Looking for more ideas beyond V.F?
If V.F has your attention, do not stop there. Use the same discipline across a broader watchlist so you are not relying on a single turnaround story.
Spot potential mispricings early by scanning our 34 high quality undervalued stocks and compare those candidates to V.F on quality and price discipline.
Build a steadier income stream by reviewing a curated set of 6 dividend fortresses that may complement a more cyclical holding like V.F.
Protect downside risk by focusing on resilience first through a 30 resilient stocks with low risk scores. Then layer in higher conviction ideas only when the foundation looks strong.
Have feedback on this article? Concerned about the content? Get in touch with us directly. Alternatively, email editorial-team@simplywallst.com