
Half Year Earnings Put Amada Shares In Focus As Full Year Outlook Faces Review
- Amada reported half year results for the period to September 30, 2026, with sales of ¥230,406 million and basic EPS from continuing operations of ¥59.04.
- The same day board meeting to consider revising full year forecasts signals management is actively reassessing demand trends, cost pressures, and execution priorities.
- Next, the focus shifts to how Amada's half year earnings and possible full year forecast revisions might reshape the broader investment narrative.
Compare how Amada's latest half year figures stack up against other machinery and automation players by scanning our hand picked 88 robotics and automation stocks that could sit on your watchlist next.
What Is Amada's Investment Narrative?
To own Amada, you need to be comfortable with a fairly traditional industrial story built on metal processing equipment, heavy capital needs, and execution discipline rather than rapid disruption. The half year print of ¥230,406 million in sales and basic EPS of ¥59.04 keeps the conversation grounded in current demand and pricing rather than blue sky expectations. With a board meeting scheduled to consider revising full year forecasts, management is effectively telling you that near term visibility on orders, costs, and utilization is front of mind.
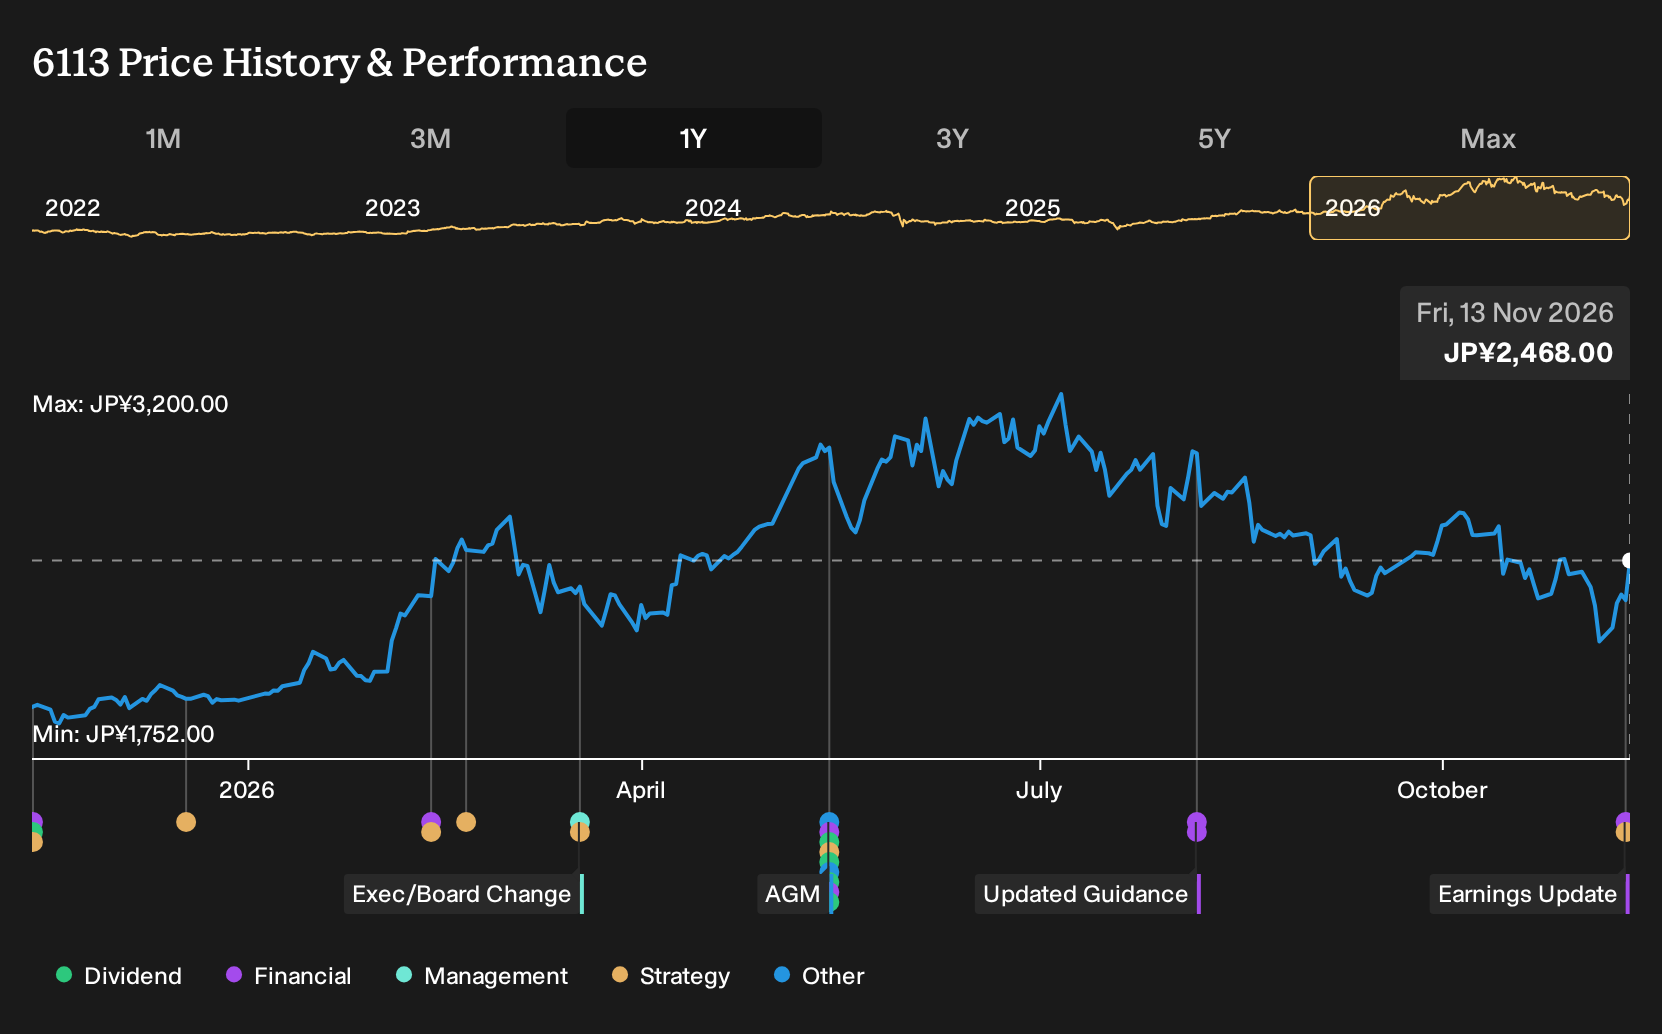
In the short term, the key swing factors are how resilient customer budgets prove for machinery, how efficiently Amada runs its factories, and whether pricing can hold if volumes soften. Earnings have grown faster than the wider Machinery industry and margins have improved, which gives some comfort on execution, but a P/E of 19.3x versus an industry 11.8x means the stock already asks you to believe that this performance is durable. Volatile recent trading and an unstable dividend record sit in the background as reminders that the ride might not be smooth.
Even so, there is a less obvious weak point in the Amada story that only really comes into focus when you look closely at ...
There's only one way to know the right time to buy, sell or hold Amada. Head to Simply Wall St's company report for the latest analysis of Amada's Fair Value.
Reach Your Own Conclusion
Don't just follow the ticker; dig into the data and build a conviction that's truly your own.
- A great starting point for your Amada research is our analysis highlighting 4 key rewards and 2 important warning signs that could impact your investment decision.
- See our latest analysis for Amada. The report includes a comprehensive fundamental analysis summarized in a single visual, the Snowflake, making it easy to evaluate Amada's overall financial health at a glance.
Looking For More Ideas Beyond Amada?
If Amada is on your radar but you want to round out your watchlist, the Simply Wall St Screener can help you compare very different types of opportunities side by side and keep your process disciplined rather than random.
- If you want potential upside without ignoring quality, scan a hand picked set of businesses using the 20 high quality undervalued stocks to see which ones fit your risk and return preferences.
- For readers who care most about resilience and lower drawdown risk, filter for companies in the 19 resilient stocks with low risk scores and see which profiles feel comfortable for your portfolio.
- If you prefer strong balance sheets and fundamentals before anything else, start with the list of solid balance sheet and fundamentals (24 results) and work through the list at your own pace.
Have feedback on this article? Concerned about the content? Get in touch with us directly. Alternatively, email editorial-team@simplywallst.com