
How to Invest Like a Cockroach in the Stock Market’s AI Era
For most of the past 30 years, investing in the stock market was like hitting a golf ball with a 25 mph wind at your back. Even a duffer like me could reach the fairway.
The reason: borrowing money got cheaper almost every year. The ZIRP era, they called it – short for Zero Interest Rate Policy. The Federal Reserve and central banks around the globe made it so money was essentially free to borrow.
And whenever there was a hiccup, like in 2008, policymakers rushed in with emergency cash. Wall Street and corporate profits soared; stock prices exploded; and an entire generation of investors was taught that you don't need a strategy: You just buy the SPDR S&P 500 ETF (SPY) or the Invesco QQQ Trust (QQQ) and let gravity do the rest.
Asset allocation – the art and science of deciding what to own, and how much of it, in your investment portfolio – was regarded in much the same way as badges in the Mel Brooks classic “Blazing Saddles”: We don’t need no stinkin’ asset allocation.
Then, that easy-money era officially hit a brick wall, starting in 2022.
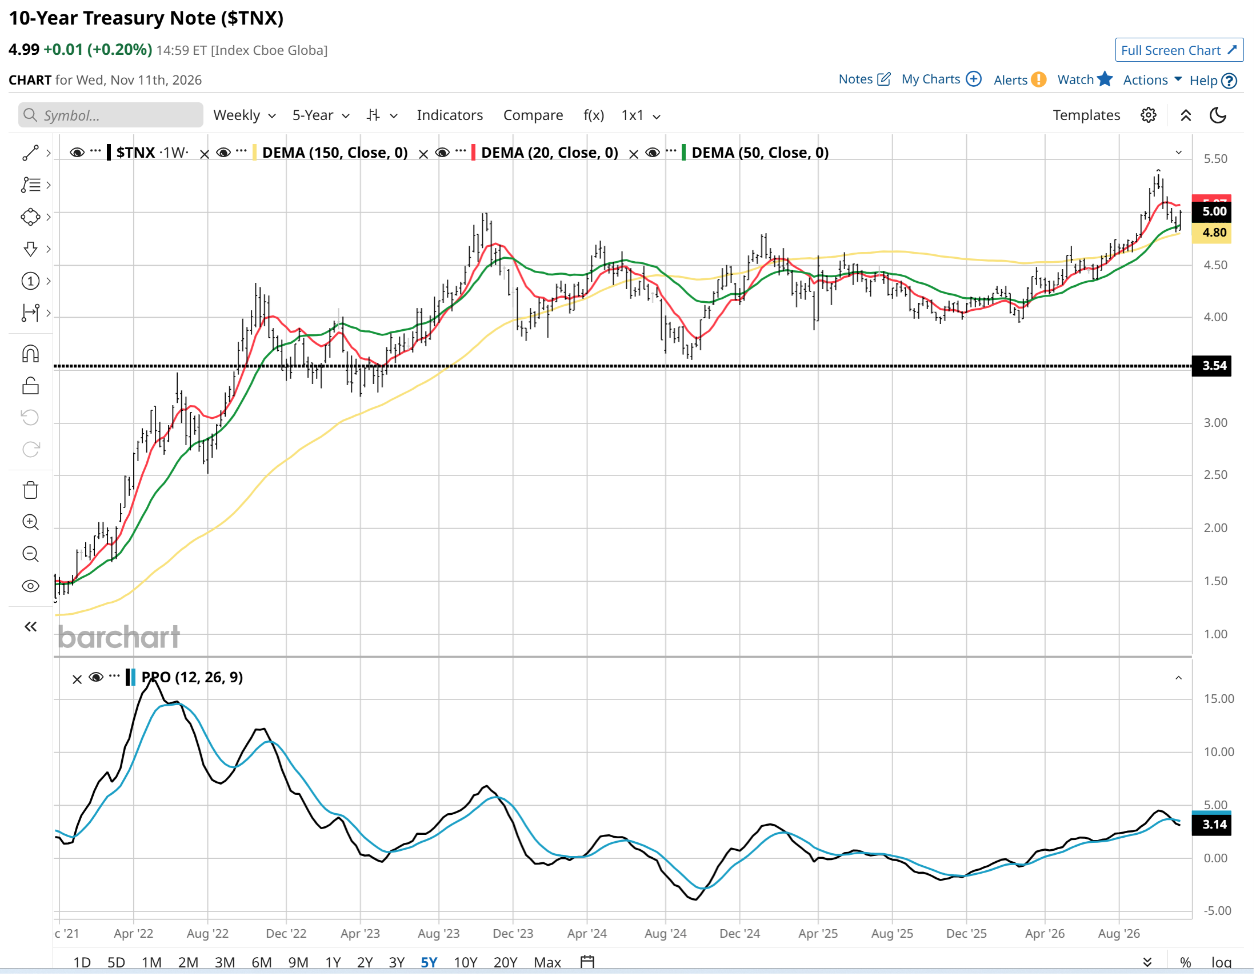
Bond investors would have experienced this as the joy of higher rates, while prospective homebuyers likely experienced more of a sinking feeling, with mortgage rates uncomfortably elevated.
A third group – investors with balanced portfolio exposure – might have experienced something that’s in all too short supply these days: a good night’s sleep.
The Cockroach Portfolio: Origins
The inspiration for this week’s column comes from both nature's ultimate survivor and from Société Générale strategist Dylan Grice, who in 2013 popularized the concept of the Cockroach Portfolio.
Cockroaches, as Bloomberg notes, have survived three planetary mass-extinction events (that we know of!). They can withstand 15 times the radiation levels lethal to humans, survive underwater for 30 minutes, and live without air for nearly three-quarters of an hour.
A cockroach does not attempt to forecast the next mass-extinction event nor the next CEO scandal. It simply maintains an evolutionary architecture capable of surviving whatever catastrophic shock hits the environment next.
To that end, Grice’s solution was an equal, four-part asset split:
- 25% Equities: To capture corporate profit expansion during economic booms.
- 25% Long-Term Government Bonds: To deliver capital gains and deflationary protection when economic growth collapses.
- 25% Cash / T-Bills: To provide dry powder and liquidity during acute financial panic.
- 25% Physical Gold: To preserve purchasing power during currency debasement, supply shocks, and runaway inflation.
Between 1973 and 2020, a permanent Cockroach Portfolio generated an annualized return of roughly 7.9%, compared to the S&P 500’s 10.5% annualized return over the same period. It did not outperform, but it saved investors some excruciating drawdowns.
The Cockroach Portfolio is composed of the most familiar assets most of us know of. It is agnostic, and exceedingly difficult to kill, financially-speaking. And, it won’t freak you out if you try to stare into its beady little eyes.
Its primary weakness, however, is rigidity: holding a static 25% allocation in long-duration government bonds during 2022 and periods of that nature, exposes you to some challenging phases.
And in the same way that we may not yet have experienced every realistic market scenario, that “set it and forget it” approach might have some holes in it.
The 2-ETF Model Portfolio Is Born
The goal when I built my 2-ETF model portfolio earlier this decade was not really to offer it as “investable.” It was simply to test out an automated version of my 40-year approach to charting stocks and ETFs.
So, a little background: I have this ROAR Score technical analysis grading system that I apply to stocks, and now portfolios. We nicknamed it the “Rob-ot,” since it’s a robotic version of me, the chartist. It produces a daily gauge of how much risk of major loss is attached to an ETF or stock, based on a 0-100 scale.
The least risky tickers at any point in time typically get a score of 70, though the metric will occasionally reach 100. The most risky usually end up around the 10-20 range, but the ROAR Score can also hit zero in extreme cases. (That’s also the time when ETFs or stocks can potentially bottom – think of the old “darkest before dawn” thing.)
The point of explaining this is to go back to where my ROAR indicator started. In an effort to simplify what I was seeing each week in scrolling through hundreds of charts using Barchart’s amazing Flipcharts feature, I wanted to quickly answer that typical question, “what do you think of the stock market here?” with a single word – or in this case, a number.
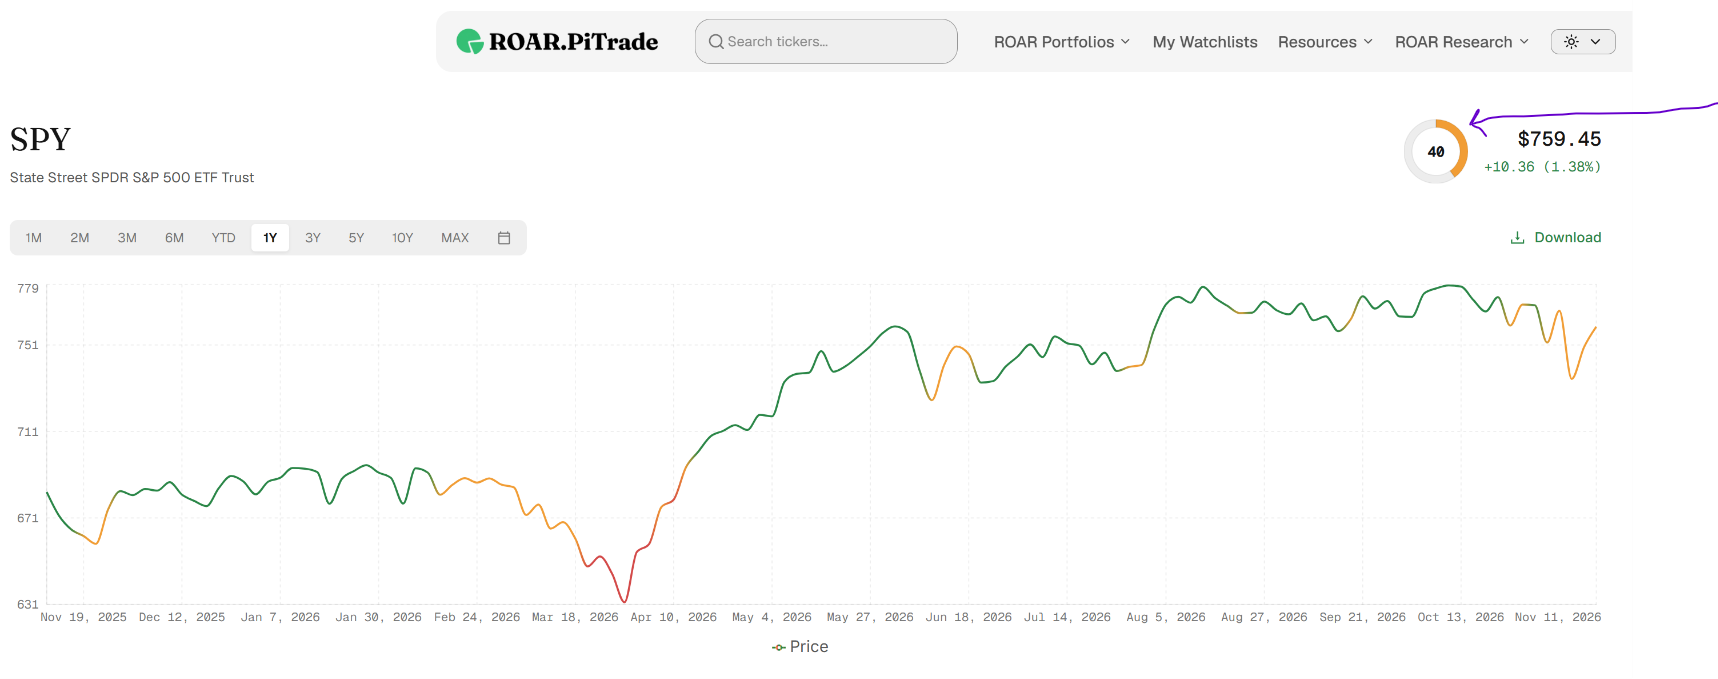
That’s how this came to be. So as pictured above, as of Wednesday’s close, the ROAR Score for SPY was 40 (translation: leaning toward above-average risk).
From there, I converted this “market in a nutshell” risk reading into the backbone for my portfolio construction model pretty easily. I started by taking the ROAR Score for SPY once a week, and assigning that same percentage of the portfolio to it. As for the rest?
That went to the SPDR Bloomberg 1-3 Month T-Bill ETF (BIL), an ETF that holds short-term T-bills – the closest thing you can get to cash on Wall Street.
For a long time, actually, these were pretty much the equivalent of stuffing dollar bills under your mattress. That’s how I assess the top part of that chart immediately below, which shows the 13-week T-bill yield going back to 2012 – about 15 years.
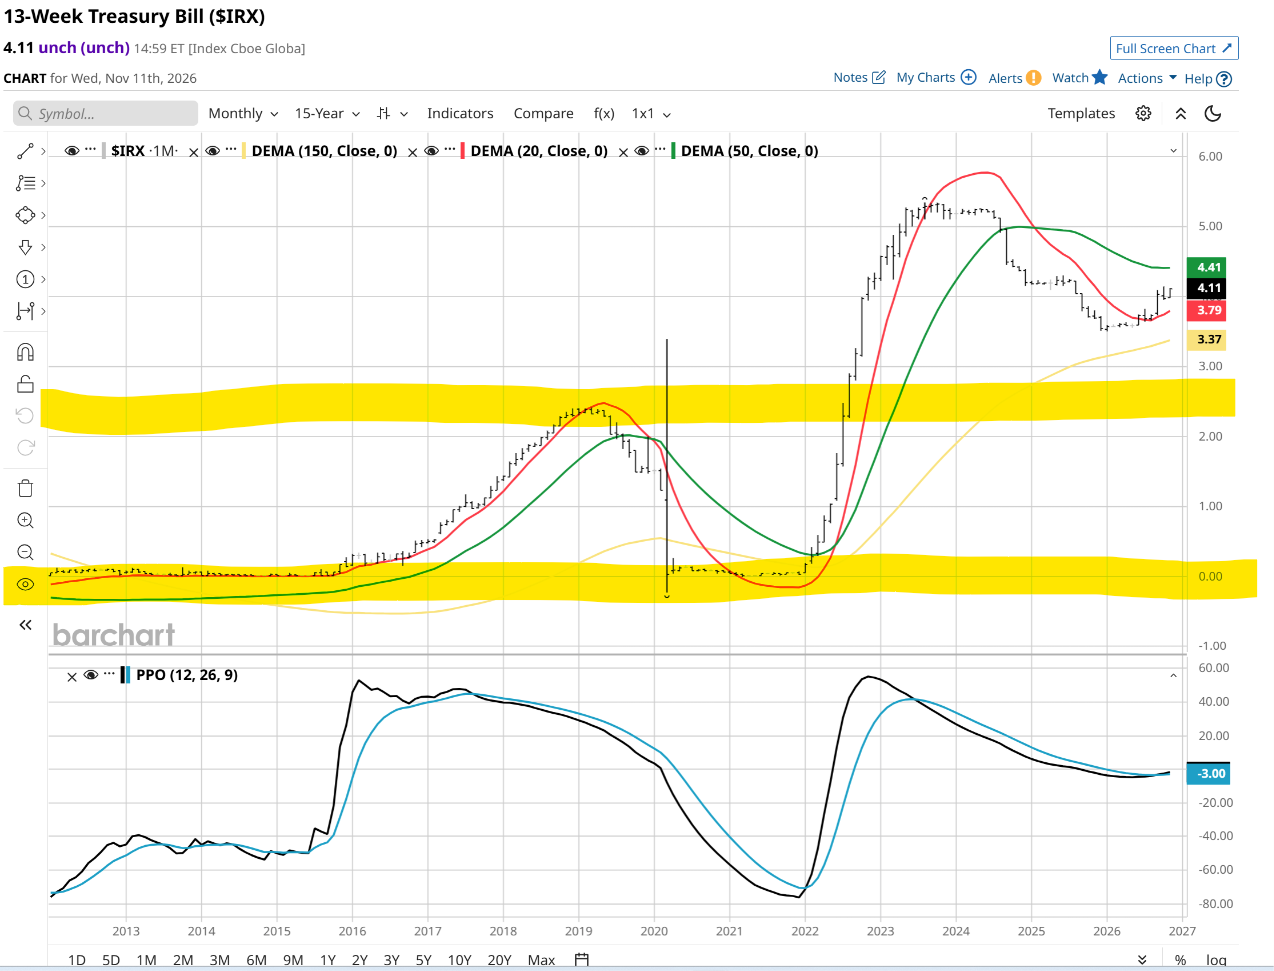
I drew those yellow highlighter lines at 0% and around 2.5%. We see that for most of this period, running from the volatility of stocks to cash or even high-quality bonds typically gave you nothing but “not equities” in your portfolio.
That ZIRP fever finally broke in early 2022, and since that time, cash rates have been in the 3-5% range. High enough to matter, at least until inflation spikes much higher (which is not a prediction, but a possibility).
Let’s bring this history lesson together, so we can move on to the items of greater impact.
Stocks and bonds (or T-bills) worked well as a pair for a long time, because bonds were nearly always going up in price (and correspondingly, down in yield). T-bills did not have price fluctuation, so their rates kept dropping toward mattress-level returns.
The strategy reached a point where it was mathematically impossible (ZIRP era) to hold bonds and expect anything more than a low return, or a negative return when rates finally moved back up. That’s why 2022 was such a train wreck.
Stocks went down, and bonds were not there to break their fall. In fact, since rising rates are what broke the stock market’s back, it is fair to say bonds pushed stocks off that perch.
Yet here we are, with bond rates swimming in the 5%-ish range, and T-bills above 4%. At the same time, the stock market looks (to me) dangerous as all get-out.
But… I don’t want to get out. I want to re-allocate!
Because I finally can. I have an alternative.
Simple ETF Allocation to Manage Risk
This is just my approach. But a funny thing happened on the way to simplicity. It proved to be a lot more popular than I imagined.
And this is the perfect time for DIY investors to get a handle on this strategic-yet-streamlined ETF portfolio allocation approach.
Why? Rising rates have made cash and bonds relevant again, and it allowed me to think through just how simple investing could be. Not for everyone – many of us still see opportunities in trading, investing in stocks, and further reaches of the market.
But for perhaps 80-90% of retail investors, I am now convinced that portfolios of between 2 and 10 ETFs – owned at all times, but in varied weights dependent on risk – is a darn competitive strategy. So I created a little series of them.
I do not by any means have a monopoly on good ideas in that space. I will, however, point out that in my view, many of the larger, entrenched folks in that space have been milking the 60/40 and overall asset allocation schtick for a very long time – much longer than it makes sense.
From 2 ETFs to 10
My main portfolio is actually one that takes the basic 2-ETF SPY/BIL core structure and runs it all the way up to 10 ETFs at a time.
In that construction, I replace SPY with QQQ and SPDR Dow Jones Industrial Average ETF Trust (DIA), as they now tend to move less in sync than before.
I add a bond ETF, the Invesco Equal Weight 0-30 Year Treasury ETF (GOVI); and an ETF that profits when bonds drop in price and rates rise (TBF), then round it out with a set of commodity and other hedging tools.
With apologies for the unpleasant cockroach conflation, the best analogy I can think of is, believe it or not, Chipotle. Everyone gets something to hold their food, and a protein. Everything else? That’s your call.
This DIY approach allows for an infinite combination of allocations in your portfolio. Just like you and your nine friends can have nine different burritos at Chipotle, you can build nine different portfolios with this ETF strategy.
That gives us the simple 2-ETF version, which you can scale all the way up to 10 ETFs in this modern form of asset allocation – while still staying very organized and disciplined.
The Metamorphosis (Rob’s Version)
Building an all-weather portfolio is an evolutionary progression. I detailed mine above. Now, it is your turn to determine what your best path is.
If you are new, it is a fresh start, and hopefully with some insight you didn’t have before you read this article.
For the grizzled old veterans, like me – if there were ever a time in market history to double-check every aspect of your asset allocation, this would be it.
Not sure where to start? One possible course to consider:
- Start with the 2-ETF Barbell: Break the habit of holding unhedged equity risk. Pair your offensive stock ETF with a cash-equivalent Treasury ETF, choose a rotation/allocation discipline, and you’re up and running.
- Embrace the Cockroach Philosophy: KISS-method it, but in a way that essentially determines over time, that “core four” of asset types is your best attempt at having your money work for you. You are counting on that long cockroach-inspired version of asset allocation, with no human or even robotic intervention.
- Add More Flexibility (Up to 10 Etfs): Employ dynamic role players like the ones I described above to try a slightly more sophisticated, tactical approach with much greater reach than any 2-4 ETF model portfolio is able to provide.
The era of effortless,rate-fueled equity market dominance is done.
But, like the irrepressible cockroach, that doesn’t mean the stock market is headed for extinction. It simply means that for many investors, surrounding the familiar equity faces with some complementary friends (ETFs) can really kick-start and sustain a portfolio plan.
Just watch out for skunks at the party, which is a different story altogether.
Rob Isbitts is a semi-retired CIO, former fiduciary investment advisor, Barchart columnist, and straight-talker. Download his new free e-book on hedged bond investing for retirement at ETFYourself.com. His research and model portfolios are at ROAR.PiTrade.com.
On the date of publication, Rob Isbitts did not directly have a position in any of the securities mentioned in this article. All information and data in this article is solely for informational purposes. For more information please view the Barchart Disclosure Policy here.