
Is It Too Late To Consider Northrop Grumman After Its Strong 2025 Share Price Rally?
- If you are wondering whether Northrop Grumman is still attractive after its recent rally or whether it might be better to wait for a different entry point, this breakdown is for you.
- The stock has quietly delivered solid returns, rising 3.2% over the last week, 3.0% over the past month, and 24.4% year to date, while gaining 25.8% over 1 year and 109.0% over 5 years.
- These moves come as defense spending tailwinds continue to support contractors across the sector, including Northrop Grumman. Investors are increasingly focused on long term programs such as missile defense and space systems. At the same time, shifting geopolitical risks have kept demand expectations elevated, which helps explain why the market is willing to pay a premium for stable cash flows.
- Right now, Northrop Grumman scores a 3/6 valuation check. This suggests it appears undervalued on some metrics but not others. In this piece, we will walk through DCF, multiples, and other approaches, then finish with a more intuitive way to think about what the market is really pricing in.
Find out why Northrop Grumman's 25.8% return over the last year is lagging behind its peers.
Approach 1: Northrop Grumman Discounted Cash Flow (DCF) Analysis
A Discounted Cash Flow model estimates what a company is worth by projecting the cash it can generate in the future and then discounting those cash flows back to today in dollar terms.
Northrop Grumman currently generates about $1.75 billion in free cash flow, and analysts, combined with Simply Wall St extrapolations, see this rising steadily over the coming decade. By 2029, free cash flow is projected to reach roughly $3.86 billion, and continue growing modestly thereafter, based on a 2 Stage Free Cash Flow to Equity model that blends analyst estimates with longer term growth assumptions.
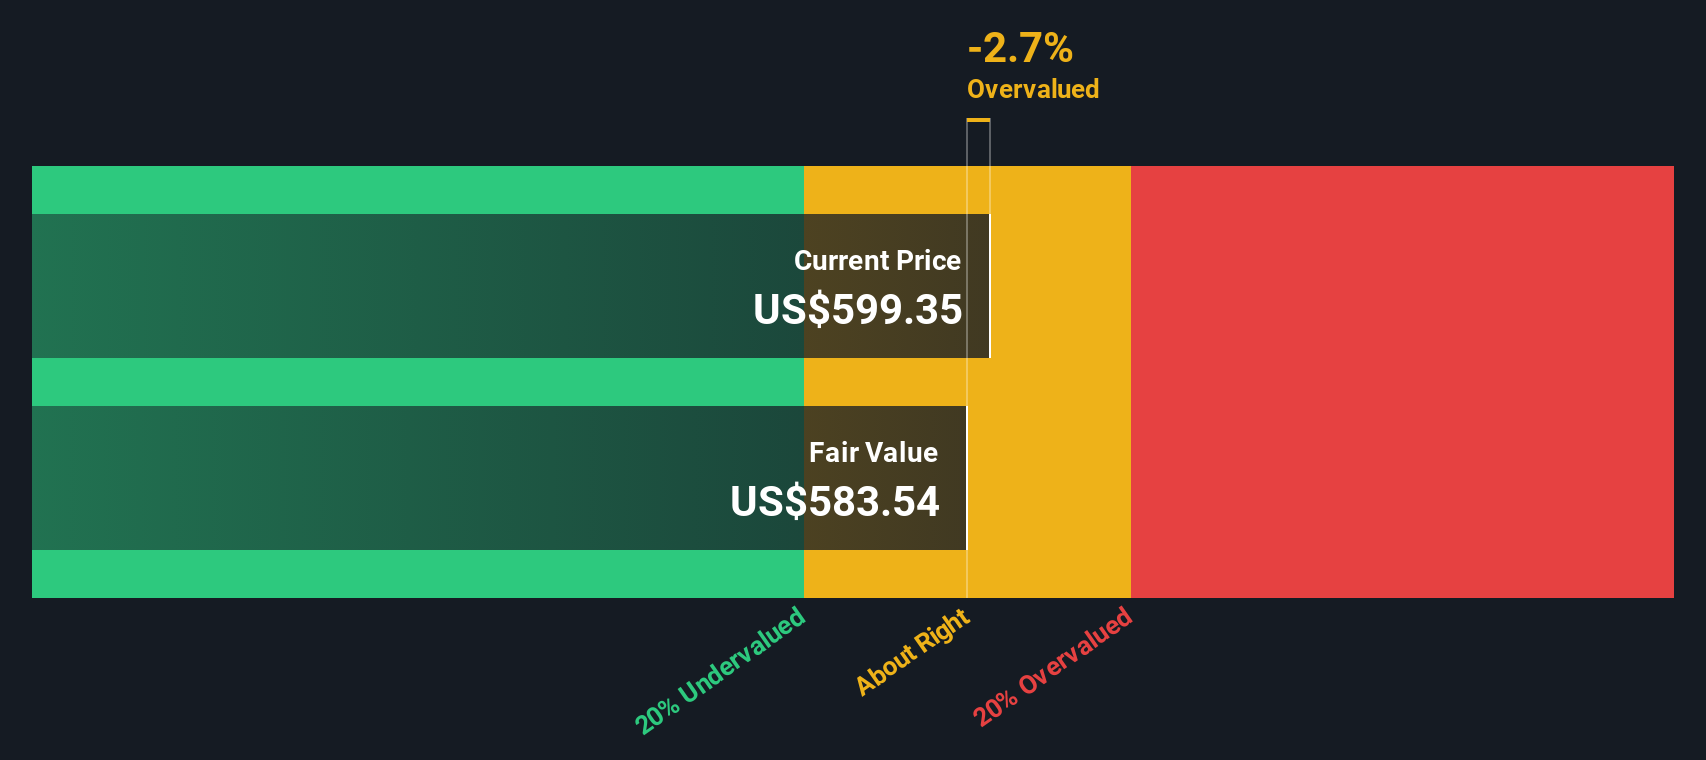
When all those future cash flows are discounted back, the intrinsic value comes out at about $511.95 per share. Compared with the current market price, this implies the stock is roughly 13.8% overvalued on a pure cash flow basis, which indicates that investors may be paying a premium for additional quality, growth, or perceived safety.
Result: OVERVALUED
Our Discounted Cash Flow (DCF) analysis suggests Northrop Grumman may be overvalued by 13.8%. Discover 901 undervalued stocks or create your own screener to find better value opportunities.
Approach 2: Northrop Grumman Price vs Earnings
For established, profitable companies like Northrop Grumman, the price to earnings ratio is often the most intuitive way to judge valuation because it directly compares what investors pay today with the profits the business is generating. In general, faster growth and lower perceived risk justify a higher PE multiple, while slower growth or higher uncertainty should lead to a lower, more conservative multiple.
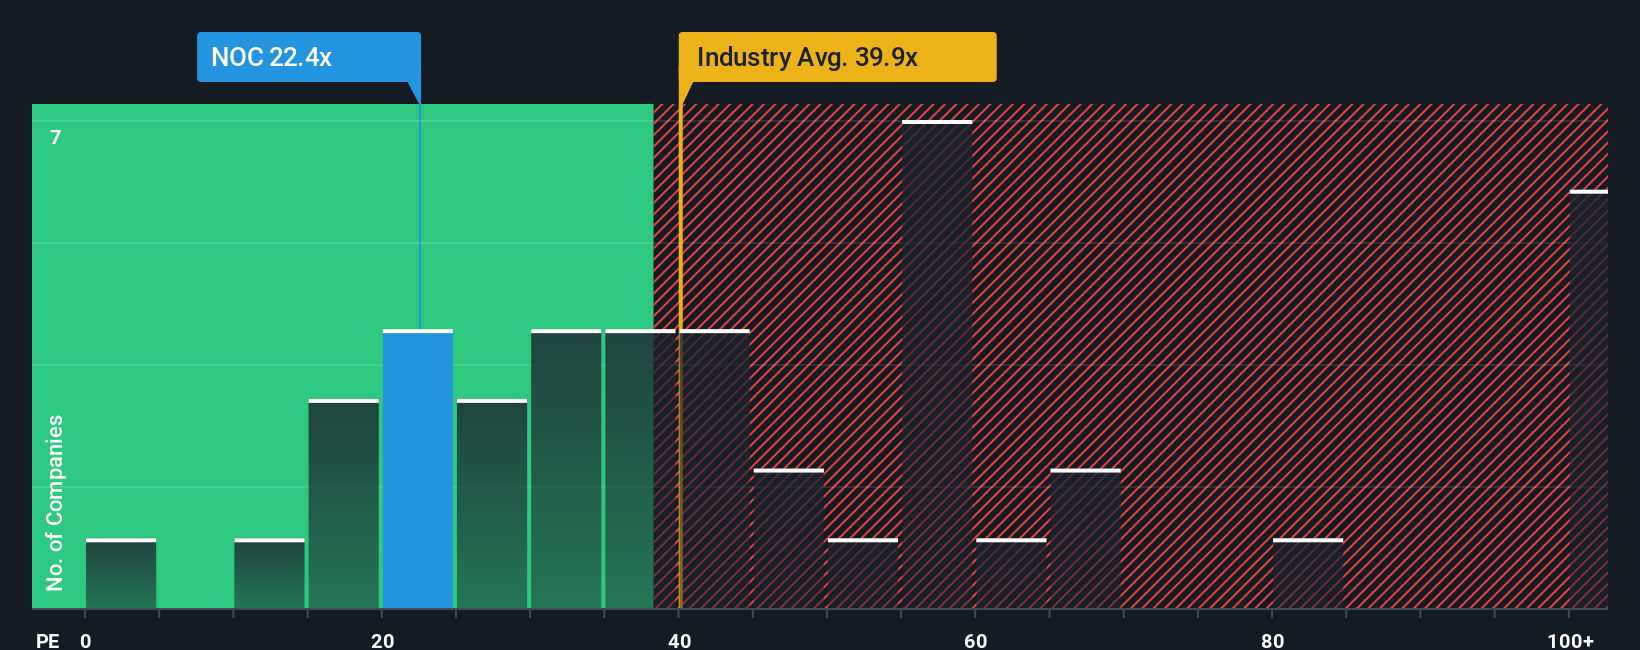
Northrop Grumman currently trades at about 20.68x earnings, which is well below both the Aerospace and Defense industry average of roughly 37.99x and a peer group average of around 36.86x. On the surface, that discount might suggest the stock is priced at a lower level relative to its sector and competitors.
Simply Wall St also calculates a Fair Ratio of 27.22x, a proprietary estimate of what Northrop Grumman’s PE should be given its earnings growth outlook, margins, size, industry and risk profile. This tends to be more informative than a simple peer or industry comparison because it adjusts for company specific fundamentals rather than assuming all defense names deserve the same multiple. Since the Fair Ratio of 27.22x is meaningfully higher than the current 20.68x, the shares appear undervalued using this framework.
Result: UNDERVALUED
PE ratios tell one story, but what if the real opportunity lies elsewhere? Discover 1459 companies where insiders are betting big on explosive growth.
Upgrade Your Decision Making: Choose your Northrop Grumman Narrative
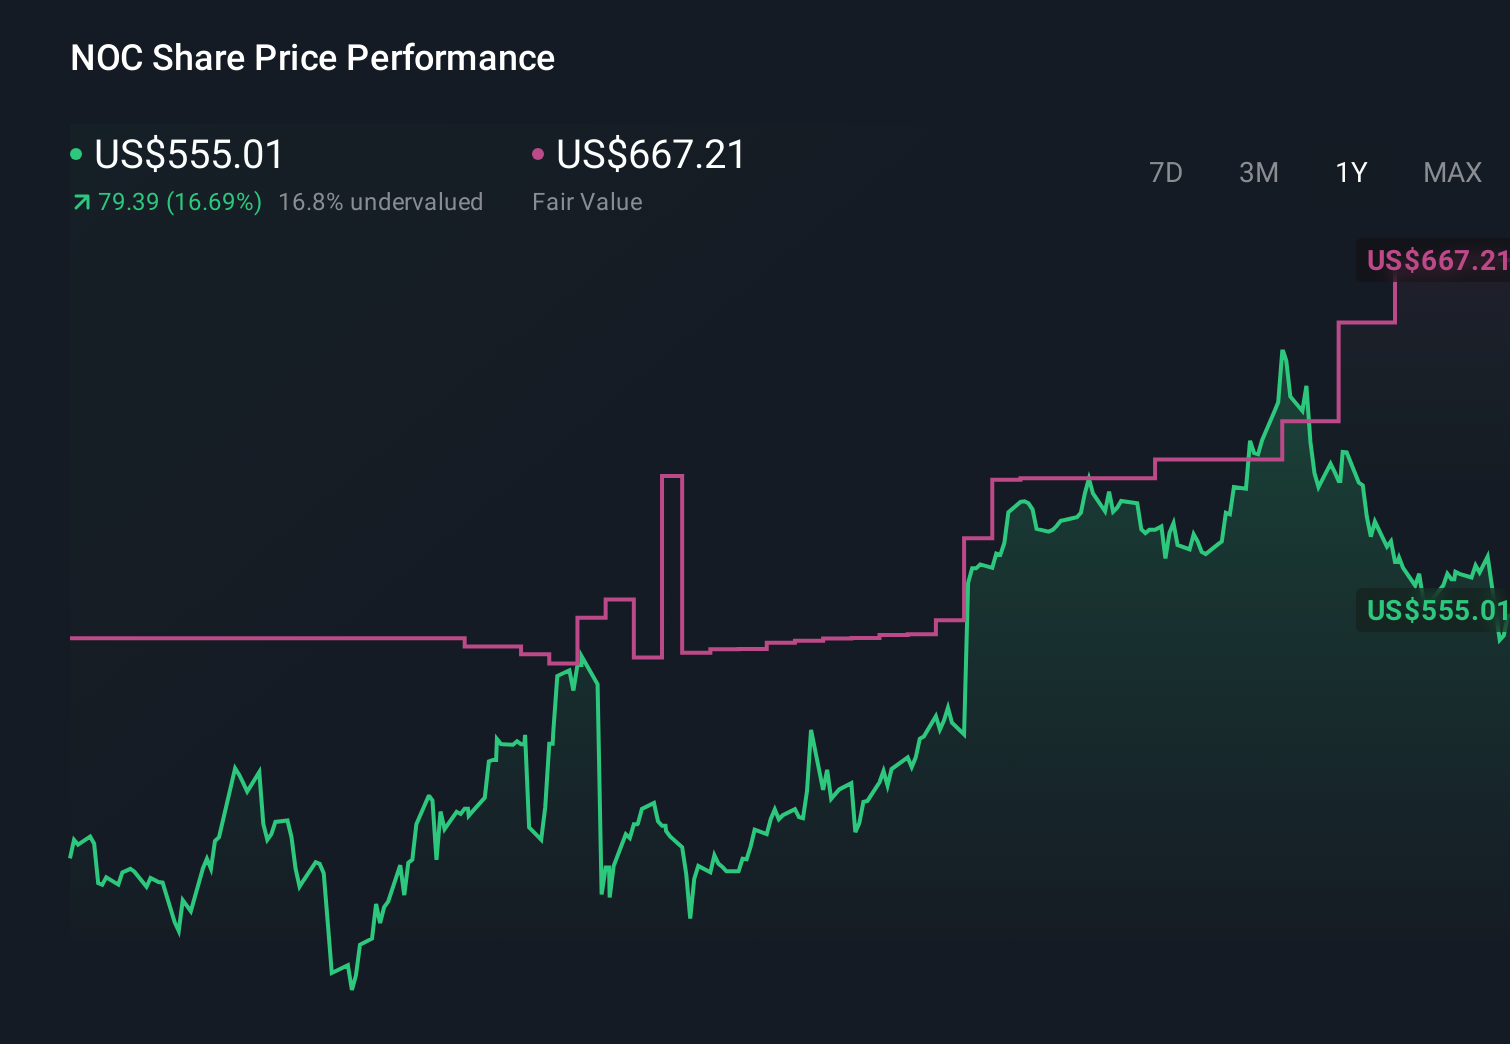
Earlier we mentioned that there is an even better way to understand valuation, so let us introduce Narratives, a simple way to attach your own story about Northrop Grumman to the numbers by laying out how you see its future revenues, earnings, and margins, then linking that story to a financial forecast and a Fair Value you can compare with today’s share price. On Simply Wall St’s Community page, used by millions of investors, Narratives make this process accessible by letting you choose or adjust assumptions, see a Fair Value update instantly, and watch it change dynamically as new information like budget headlines or quarterly earnings comes in. For example, one optimistic Northrop Grumman Narrative might lean toward the upper analyst target of around $690 per share on the view that defense budgets, programs like B 21 and Sentinel, and cash flows will outperform. A more cautious Narrative could sit closer to $510, assuming tighter budgets or execution risks. In each case, the gap between a Narrative’s Fair Value and the current price can help frame how an investor might think about the stock.
Do you think there's more to the story for Northrop Grumman? Head over to our Community to see what others are saying!
This article by Simply Wall St is general in nature. We provide commentary based on historical data and analyst forecasts only using an unbiased methodology and our articles are not intended to be financial advice. It does not constitute a recommendation to buy or sell any stock, and does not take account of your objectives, or your financial situation. We aim to bring you long-term focused analysis driven by fundamental data. Note that our analysis may not factor in the latest price-sensitive company announcements or qualitative material. Simply Wall St has no position in any stocks mentioned.
Have feedback on this article? Concerned about the content? Get in touch with us directly. Alternatively, email editorial-team@simplywallst.com