
Cochin Shipyard's (NSE:COCHINSHIP) investors will be pleased with their enviable 886% return over the last five years
For many, the main point of investing in the stock market is to achieve spectacular returns. While not every stock performs well, when investors win, they can win big. For example, the Cochin Shipyard Limited (NSE:COCHINSHIP) share price is up a whopping 758% in the last half decade, a handsome return for long term holders. And this is just one example of the epic gains achieved by some long term investors. The last week saw the share price soften some 1.7%. It really delights us to see such great share price performance for investors.
So let's investigate and see if the longer term performance of the company has been in line with the underlying business' progress.
To paraphrase Benjamin Graham: Over the short term the market is a voting machine, but over the long term it's a weighing machine. By comparing earnings per share (EPS) and share price changes over time, we can get a feel for how investor attitudes to a company have morphed over time.
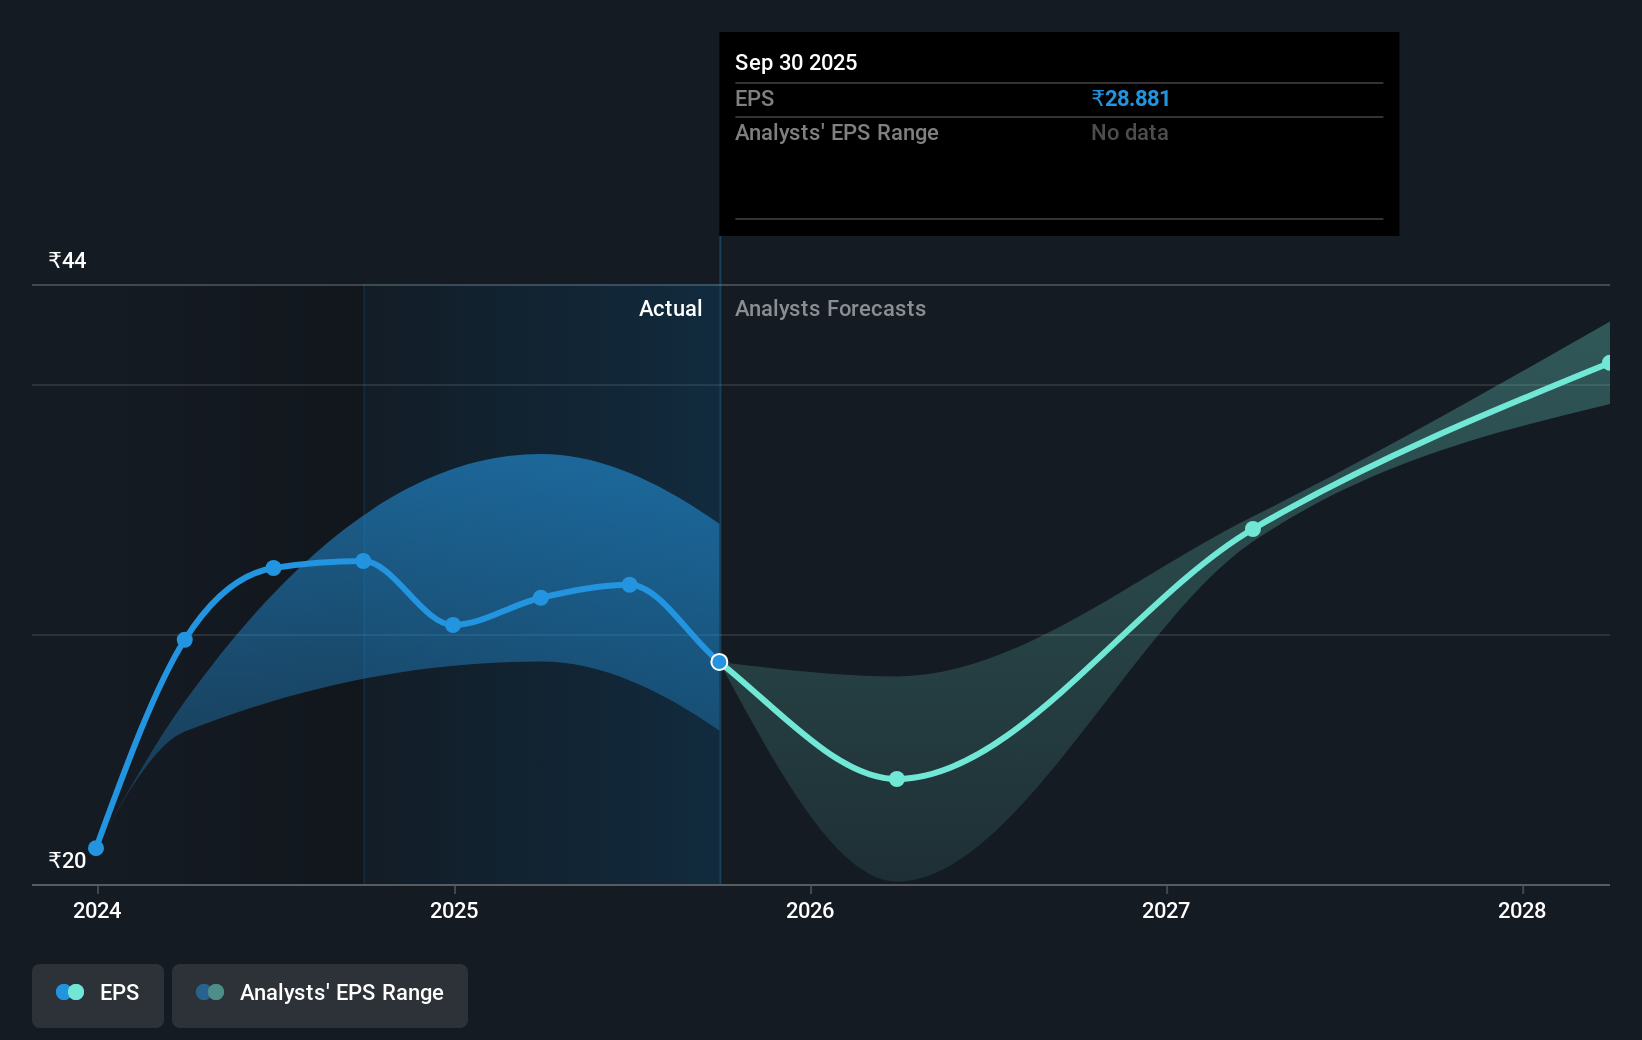
During five years of share price growth, Cochin Shipyard achieved compound earnings per share (EPS) growth of 11% per year. This EPS growth is slower than the share price growth of 54% per year, over the same period. So it's fair to assume the market has a higher opinion of the business than it did five years ago. And that's hardly shocking given the track record of growth. This favorable sentiment is reflected in its (fairly optimistic) P/E ratio of 56.72.
You can see how EPS has changed over time in the image below (click on the chart to see the exact values).
We're pleased to report that the CEO is remunerated more modestly than most CEOs at similarly capitalized companies. It's always worth keeping an eye on CEO pay, but a more important question is whether the company will grow earnings throughout the years. This free interactive report on Cochin Shipyard's earnings, revenue and cash flow is a great place to start, if you want to investigate the stock further.
What About Dividends?
It is important to consider the total shareholder return, as well as the share price return, for any given stock. Whereas the share price return only reflects the change in the share price, the TSR includes the value of dividends (assuming they were reinvested) and the benefit of any discounted capital raising or spin-off. It's fair to say that the TSR gives a more complete picture for stocks that pay a dividend. We note that for Cochin Shipyard the TSR over the last 5 years was 886%, which is better than the share price return mentioned above. And there's no prize for guessing that the dividend payments largely explain the divergence!
A Different Perspective
We're pleased to report that Cochin Shipyard shareholders have received a total shareholder return of 4.8% over one year. That's including the dividend. Having said that, the five-year TSR of 58% a year, is even better. The pessimistic view would be that be that the stock has its best days behind it, but on the other hand the price might simply be moderating while the business itself continues to execute. It's always interesting to track share price performance over the longer term. But to understand Cochin Shipyard better, we need to consider many other factors. For instance, we've identified 2 warning signs for Cochin Shipyard (1 shouldn't be ignored) that you should be aware of.
If you are like me, then you will not want to miss this free list of undervalued small caps that insiders are buying.
Please note, the market returns quoted in this article reflect the market weighted average returns of stocks that currently trade on Indian exchanges.
Have feedback on this article? Concerned about the content? Get in touch with us directly. Alternatively, email editorial-team (at) simplywallst.com.
This article by Simply Wall St is general in nature. We provide commentary based on historical data and analyst forecasts only using an unbiased methodology and our articles are not intended to be financial advice. It does not constitute a recommendation to buy or sell any stock, and does not take account of your objectives, or your financial situation. We aim to bring you long-term focused analysis driven by fundamental data. Note that our analysis may not factor in the latest price-sensitive company announcements or qualitative material. Simply Wall St has no position in any stocks mentioned.