
3 Stocks Possibly Trading At Discounts Ranging From 10.4% To 20.2%
As the United States stock market experiences a slight downturn with major indexes closing lower for the third consecutive session, investors are keenly observing opportunities amidst fluctuating conditions. In such an environment, identifying stocks that may be undervalued can present potential advantages, especially when these stocks are trading at discounts ranging from 10.4% to 20.2%.
Top 10 Undervalued Stocks Based On Cash Flows In The United States
| Name | Current Price | Fair Value (Est) | Discount (Est) |
| WidePoint (WYY) | $5.51 | $10.78 | 48.9% |
| Valley National Bancorp (VLY) | $11.775 | $23.04 | 48.9% |
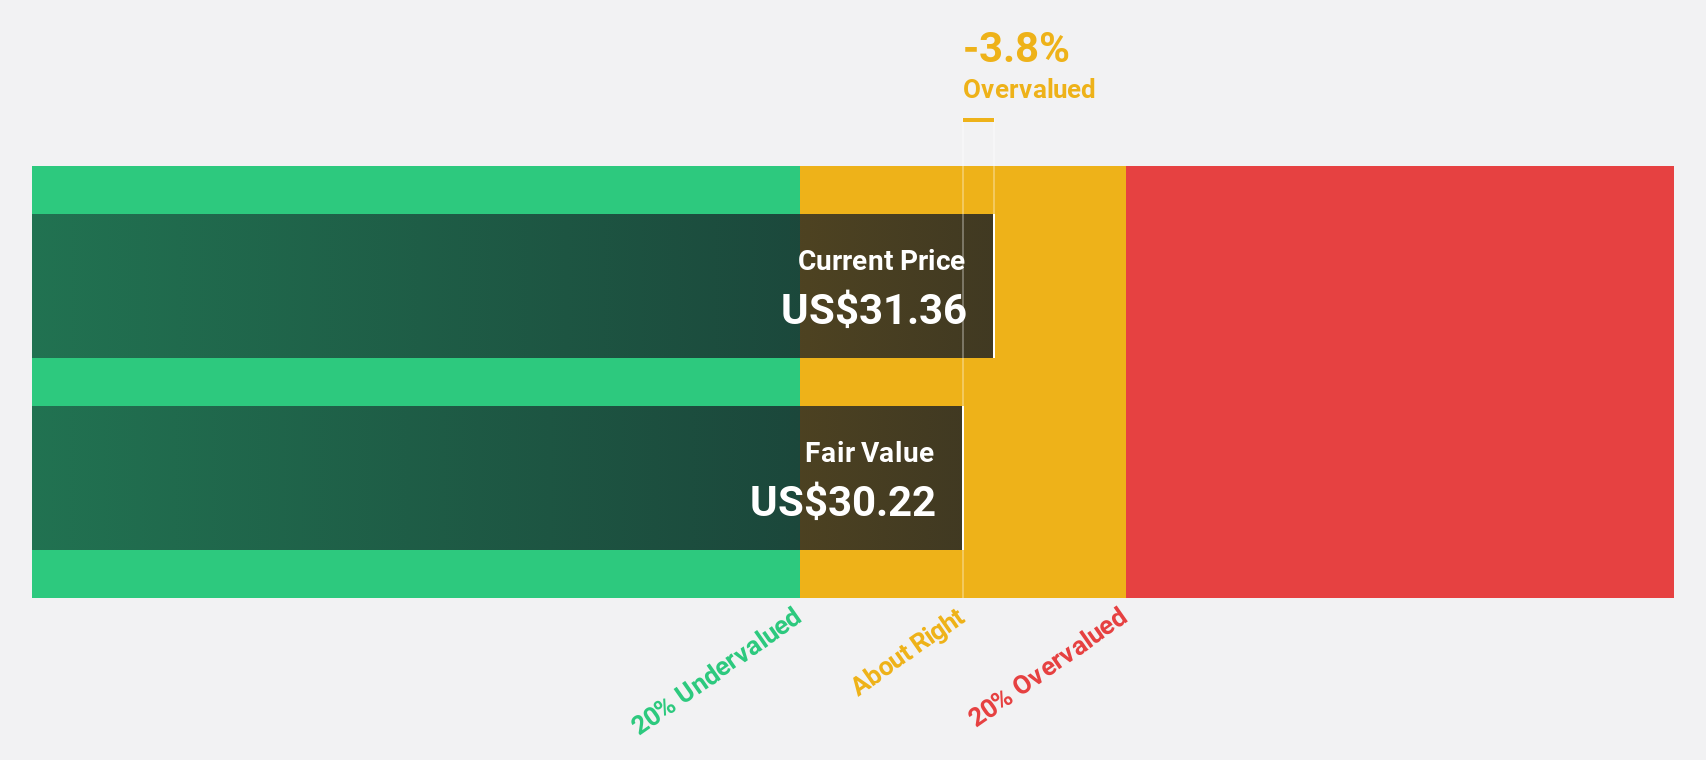
| SmartStop Self Storage REIT (SMA) | $31.38 | $61.29 | 48.8% |
| Perfect (PERF) | $1.76 | $3.43 | 48.7% |
| Nicolet Bankshares (NIC) | $122.02 | $242.21 | 49.6% |
| Investar Holding (ISTR) | $26.90 | $52.60 | 48.9% |
| Horizon Bancorp (HBNC) | $17.04 | $33.87 | 49.7% |
| Fifth Third Bancorp (FITB) | $47.53 | $93.81 | 49.3% |
| Dime Community Bancshares (DCOM) | $30.42 | $60.09 | 49.4% |
| Clearfield (CLFD) | $29.42 | $58.41 | 49.6% |
Let's uncover some gems from our specialized screener.
Li Auto (LI)
Overview: Li Auto Inc. operates in the energy vehicle market in the People's Republic of China with a market capitalization of approximately $17.43 billion.
Operations: The company generates revenue primarily from its Auto Manufacturers segment, amounting to CN¥127.81 billion.
Estimated Discount To Fair Value: 20.2%
Li Auto is trading below its estimated fair value, presenting potential undervaluation based on cash flows. Despite a significant profit margin decline from 7.2% to 3.6%, the company's earnings are expected to grow significantly over the next three years, outpacing the broader US market. However, recent quarterly results show a net loss of CNY 624.98 million and decreased revenue compared to last year, alongside insider selling activity in recent months.
- Our comprehensive growth report raises the possibility that Li Auto is poised for substantial financial growth.
- Click here and access our complete balance sheet health report to understand the dynamics of Li Auto.
Pure Storage (PSTG)
Overview: Pure Storage, Inc. is a company that offers data storage and management technologies, products, and services both in the United States and internationally, with a market cap of approximately $22.59 billion.
Operations: The company's revenue is derived from its computer storage devices segment, which generated $3.48 billion.
Estimated Discount To Fair Value: 10.6%
Pure Storage is trading at US$67.79, slightly below its estimated fair value of US$75.8, suggesting potential undervaluation based on cash flows. The company forecasts robust earnings growth of 35.5% annually, surpassing the broader US market's expectations. Recent buyback activity and increased guidance for fiscal year 2026 reflect management confidence in future performance despite a slight dip in recent quarterly net income compared to last year.
- Upon reviewing our latest growth report, Pure Storage's projected financial performance appears quite optimistic.
- Unlock comprehensive insights into our analysis of Pure Storage stock in this financial health report.

Rush Street Interactive (RSI)
Overview: Rush Street Interactive, Inc. is an online casino and sports betting company operating in the United States, Canada, and Latin America with a market cap of $4.53 billion.
Operations: The company generates revenue from its online gaming and retail sports betting segment, totaling $1.06 billion.
Estimated Discount To Fair Value: 10.4%
Rush Street Interactive is trading at US$20.11, below its estimated fair value of US$22.43, indicating potential undervaluation based on cash flows. The company forecasts significant earnings growth of 32.3% annually, outpacing the broader US market's expectations. Recent earnings reports show a substantial increase in net income and sales year-over-year, with raised revenue guidance for 2025 reflecting management's confidence despite no recent buyback activity under their repurchase program.
- Our earnings growth report unveils the potential for significant increases in Rush Street Interactive's future results.
- Take a closer look at Rush Street Interactive's balance sheet health here in our report.
Make It Happen
- Investigate our full lineup of 192 Undervalued US Stocks Based On Cash Flows right here.
- Have you diversified into these companies? Leverage the power of Simply Wall St's portfolio to keep a close eye on market movements affecting your investments.
- Simply Wall St is a revolutionary app designed for long-term stock investors, it's free and covers every market in the world.
Looking For Alternative Opportunities?
- Explore high-performing small cap companies that haven't yet garnered significant analyst attention.
- Diversify your portfolio with solid dividend payers offering reliable income streams to weather potential market turbulence.
- Fuel your portfolio with companies showing strong growth potential, backed by optimistic outlooks both from analysts and management.
This article by Simply Wall St is general in nature. We provide commentary based on historical data and analyst forecasts only using an unbiased methodology and our articles are not intended to be financial advice. It does not constitute a recommendation to buy or sell any stock, and does not take account of your objectives, or your financial situation. We aim to bring you long-term focused analysis driven by fundamental data. Note that our analysis may not factor in the latest price-sensitive company announcements or qualitative material. Simply Wall St has no position in any stocks mentioned.
Have feedback on this article? Concerned about the content? Get in touch with us directly. Alternatively, email editorial-team@simplywallst.com