
Is Netflix Still Attractive After Its Multi Year Surge and Recent Share Price Pullback
- If you are wondering whether Netflix is still attractive at today's price, or if most of the upside is already reflected in the share price, you are not alone. That is exactly what this breakdown aims to unpack.
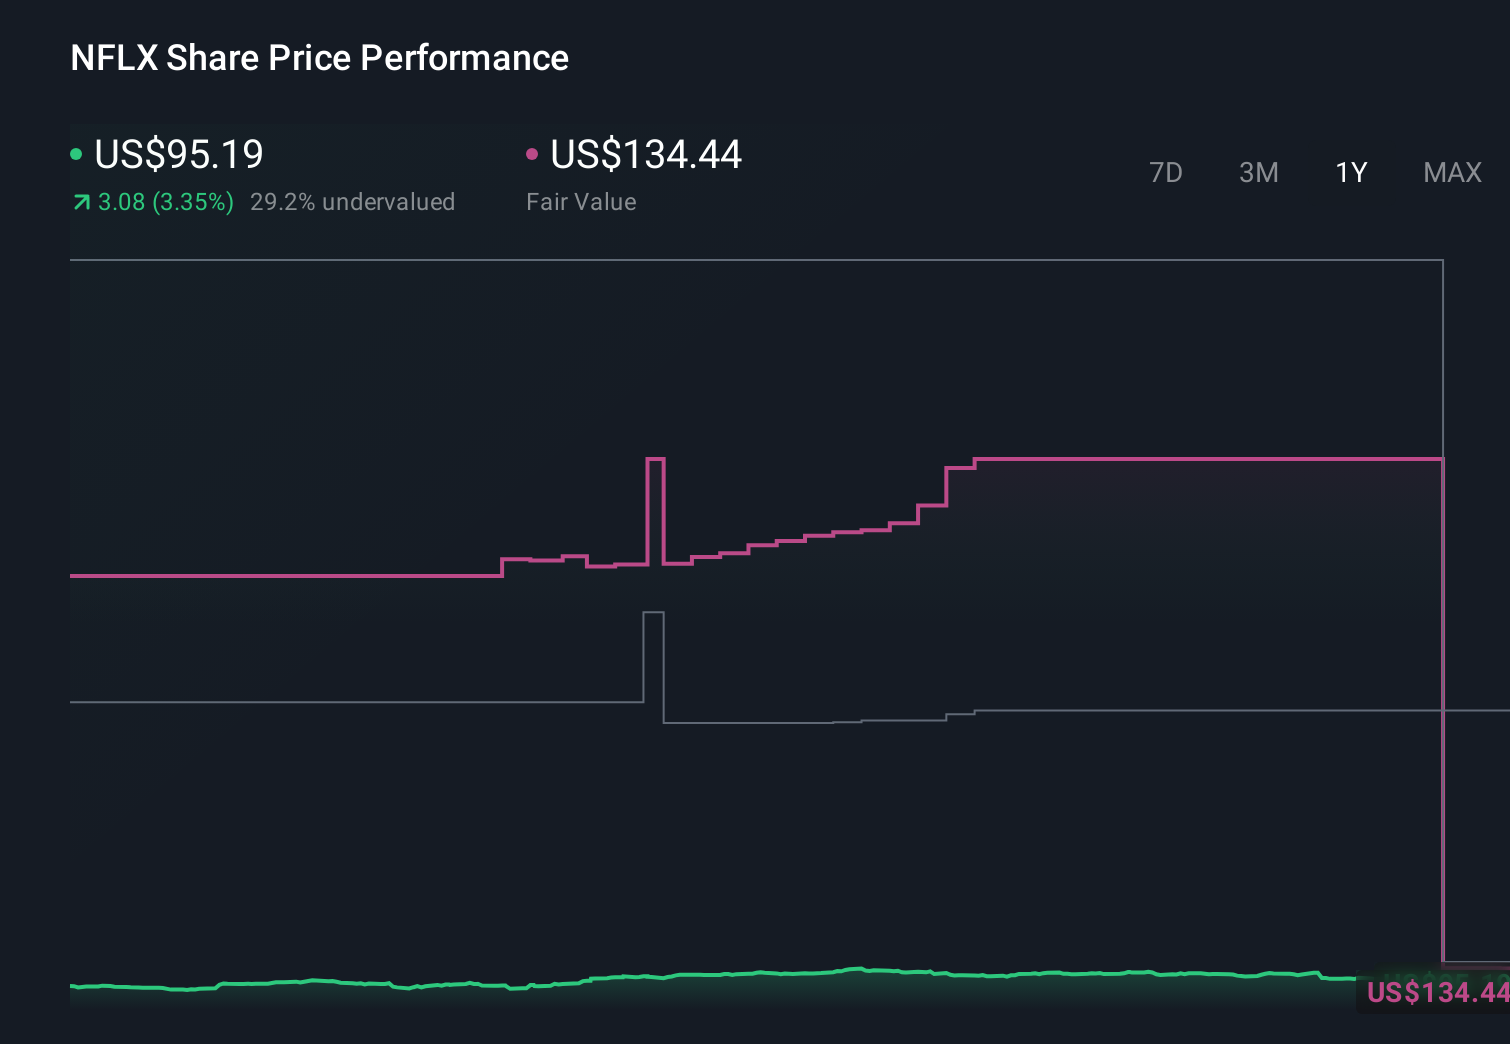
- Despite being roughly flat year to date at 0.0%, the stock has cooled off recently, with a 3.7% drop over the last week and a 9.2% pullback across the past month, even after delivering a 188.4% gain over three years and 78.3% over five.
- Recent headlines have focused on Netflix doubling down on its ad supported tier and password sharing crackdown strategy, as well as expanding licensing deals that increase the size of its content library. These moves are shaping how investors think about its long term growth potential and may help explain why the market has been reassessing the stock after such a strong multi year run.
- Right now Netflix scores only 1 out of 6 on our undervaluation checks. This raises the question of whether traditional valuation tools are missing something and sets us up to compare a few different methods before introducing a potentially more insightful way to think about what the stock is really worth.
Netflix scores just 1/6 on our valuation checks. See what other red flags we found in the full valuation breakdown.
Approach 1: Netflix Discounted Cash Flow (DCF) Analysis
A Discounted Cash Flow model estimates what a business is worth today by projecting the cash it can generate in the future and then discounting those cash flows back to a present value.
For Netflix, the starting point is last twelve months Free Cash Flow of about $9.1 billion. Analysts and extrapolated estimates from Simply Wall St expect this to grow steadily, with Free Cash Flow projected to reach roughly $23.2 billion by 2030. Beyond the explicit analyst window, the model continues to extrapolate growth at gradually slowing rates. This reflects a maturing but still expanding business.
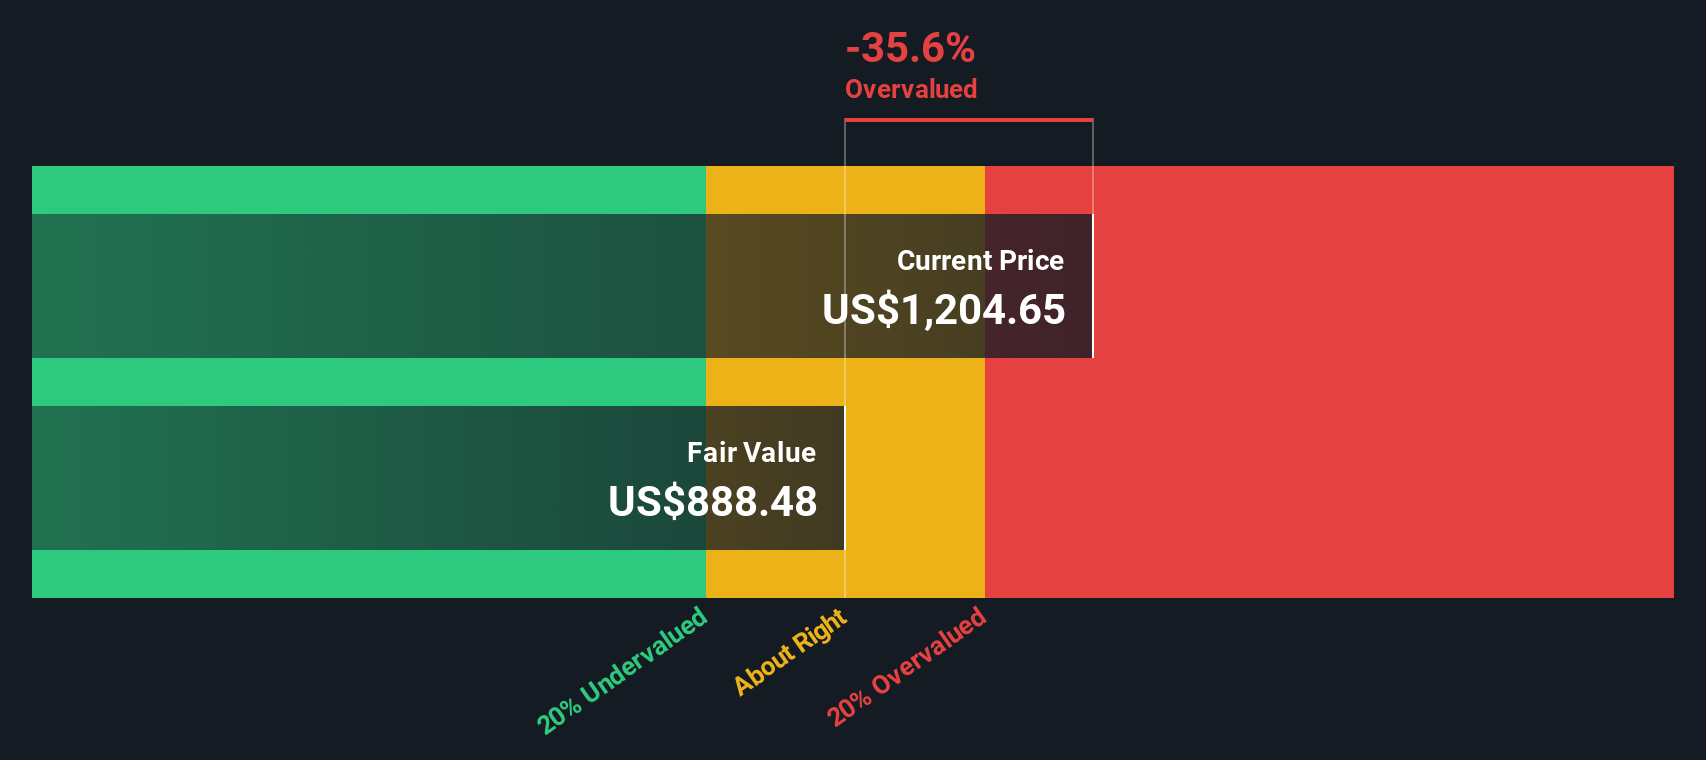
When all those future cash flows are discounted back, the DCF model used here, a 2 Stage Free Cash Flow to Equity approach, arrives at an intrinsic value of about $81.63 per share. Based on this, Netflix appears roughly 11.5% overvalued relative to its current share price. This suggests that much of the anticipated growth may already be priced in.
Result: OVERVALUED
Our Discounted Cash Flow (DCF) analysis suggests Netflix may be overvalued by 11.5%. Discover 875 undervalued stocks or create your own screener to find better value opportunities.
Approach 2: Netflix Price vs Earnings
For profitable, mature growth businesses like Netflix, the Price to Earnings ratio is a useful shorthand because it links what investors are paying directly to the profits the company is generating today. A company with faster, more reliable earnings growth and lower perceived risk can usually justify trading on a higher PE, while slower or more volatile earners typically deserve a lower, more conservative multiple.
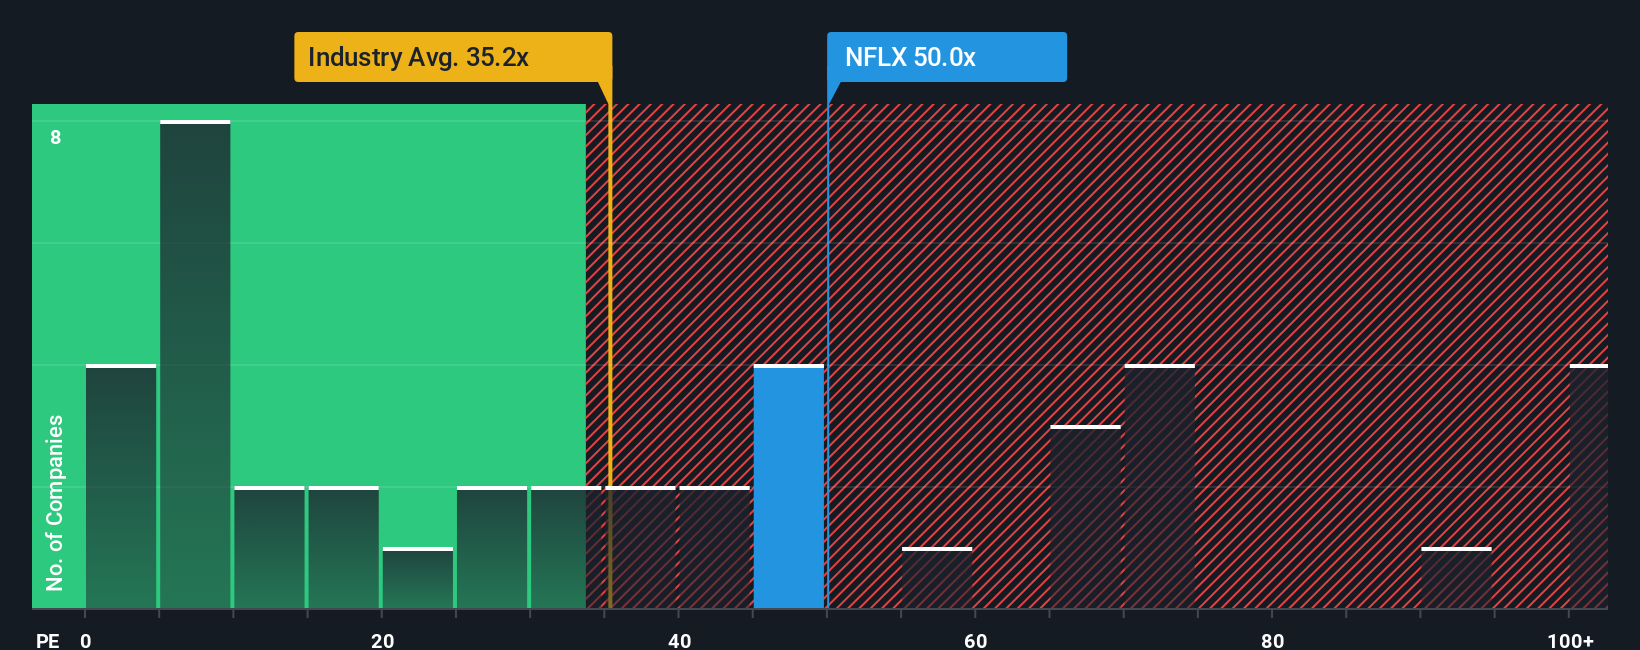
Netflix currently trades on a PE of about 39.9x, more than double the Entertainment industry average of roughly 18.3x and well below its peer group average of around 84.3x. To refine this comparison, Simply Wall St uses a proprietary Fair Ratio, which estimates what a reasonable PE should be after accounting for Netflix's earnings growth outlook, profit margins, industry positioning, market cap and specific risk profile.
On this basis, Netflix's Fair Ratio is 34.4x, implying the shares trade at a premium to what those fundamentals alone would justify. Because this Fair Ratio is tailored to Netflix rather than being a blunt industry or peer comparison, it offers a more nuanced signal that the market may be paying up for the story.
Result: OVERVALUED
PE ratios tell one story, but what if the real opportunity lies elsewhere? Discover 1464 companies where insiders are betting big on explosive growth.
Upgrade Your Decision Making: Choose your Netflix Narrative
Earlier we mentioned that there is an even better way to understand valuation, so let's introduce you to Narratives, a simple framework on Simply Wall St's Community page that lets you turn your view of a company's story into concrete numbers by connecting your assumptions about future revenue, earnings and margins to a Fair Value estimate that you can compare against today's share price to decide whether to buy, hold or sell. A Narrative is your story behind the numbers, linking what you believe about Netflix's competitive edge, content strategy, ad tier, or deal pipeline to a forward looking forecast and, ultimately, a fair value that updates dynamically as new news, earnings and analyst revisions come in, so your thesis never goes stale. For example, one bullish Netflix Narrative on the platform might lean into aggressive ad tech and margin expansion to justify a fair value closer to the highest analyst target of $1,600, while a more cautious Narrative could assume slower growth, rising content costs and weaker pricing power to land nearer the $750 bear case, giving you a transparent, side by side view of how different perspectives translate into very different valuations.
Do you think there's more to the story for Netflix? Head over to our Community to see what others are saying!
This article by Simply Wall St is general in nature. We provide commentary based on historical data and analyst forecasts only using an unbiased methodology and our articles are not intended to be financial advice. It does not constitute a recommendation to buy or sell any stock, and does not take account of your objectives, or your financial situation. We aim to bring you long-term focused analysis driven by fundamental data. Note that our analysis may not factor in the latest price-sensitive company announcements or qualitative material. Simply Wall St has no position in any stocks mentioned.
Have feedback on this article? Concerned about the content? Get in touch with us directly. Alternatively, email editorial-team@simplywallst.com