
Is It Too Late To Consider Broadcom After Its 50% Jump And AI Chip Surge?
- If you are wondering whether Broadcom is still a smart buy after its huge run up, or if the easy money has already been made, you are in the right place to unpack what the current price really implies.
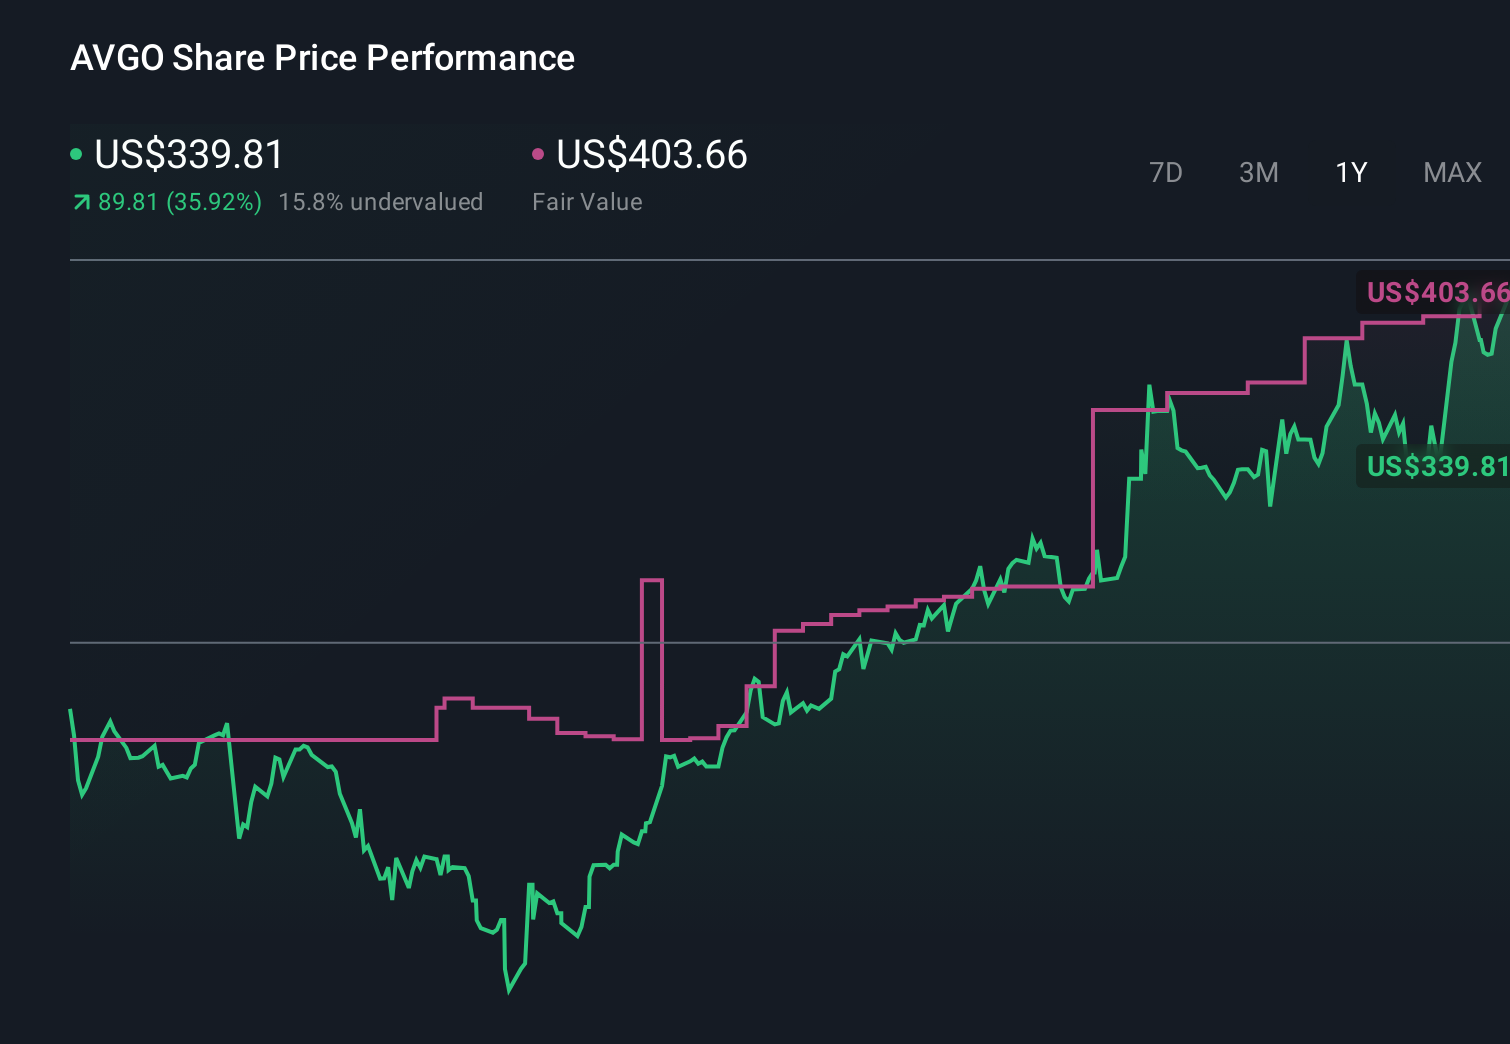
- Even after a recent pullback of about 11% over the last month and a slightly negative week, Broadcom is still up an eye catching 50.8% over the past year and 517.9% over three years, which naturally raises questions about how much upside is left.
- Those moves have come as Broadcom keeps expanding its footprint in high demand areas such as AI focused data center chips and custom silicon, while also integrating major acquisitions that reshape its software and networking exposure. Together, these developments have influenced how some investors think about Broadcom's growth potential and risk profile, contributing to the strong multi year share price performance.
- Despite that track record, Broadcom only scores 1 out of 6 on our valuation checks, suggesting the market may already be pricing in a lot of optimism, at least by some traditional yardsticks. Next we will walk through the main valuation approaches investors use for Broadcom and introduce a more complete way to think about value that we will return to at the end of the article.
Broadcom scores just 1/6 on our valuation checks. See what other red flags we found in the full valuation breakdown.
Approach 1: Broadcom Discounted Cash Flow (DCF) Analysis
A Discounted Cash Flow model estimates what a business is worth today by projecting its future cash flows and discounting them back into current dollars. For Broadcom, the model starts with last twelve months free cash flow of about $26.9 billion, already a very substantial base.
Analysts and extrapolations used in this 2 Stage Free Cash Flow to Equity model see free cash flow rising to roughly $107.1 billion by 2030, with intermediate projections climbing steadily through the late 2020s. Simply Wall St uses analyst estimates for the first few years, then extends the trend at slowing growth rates further out.
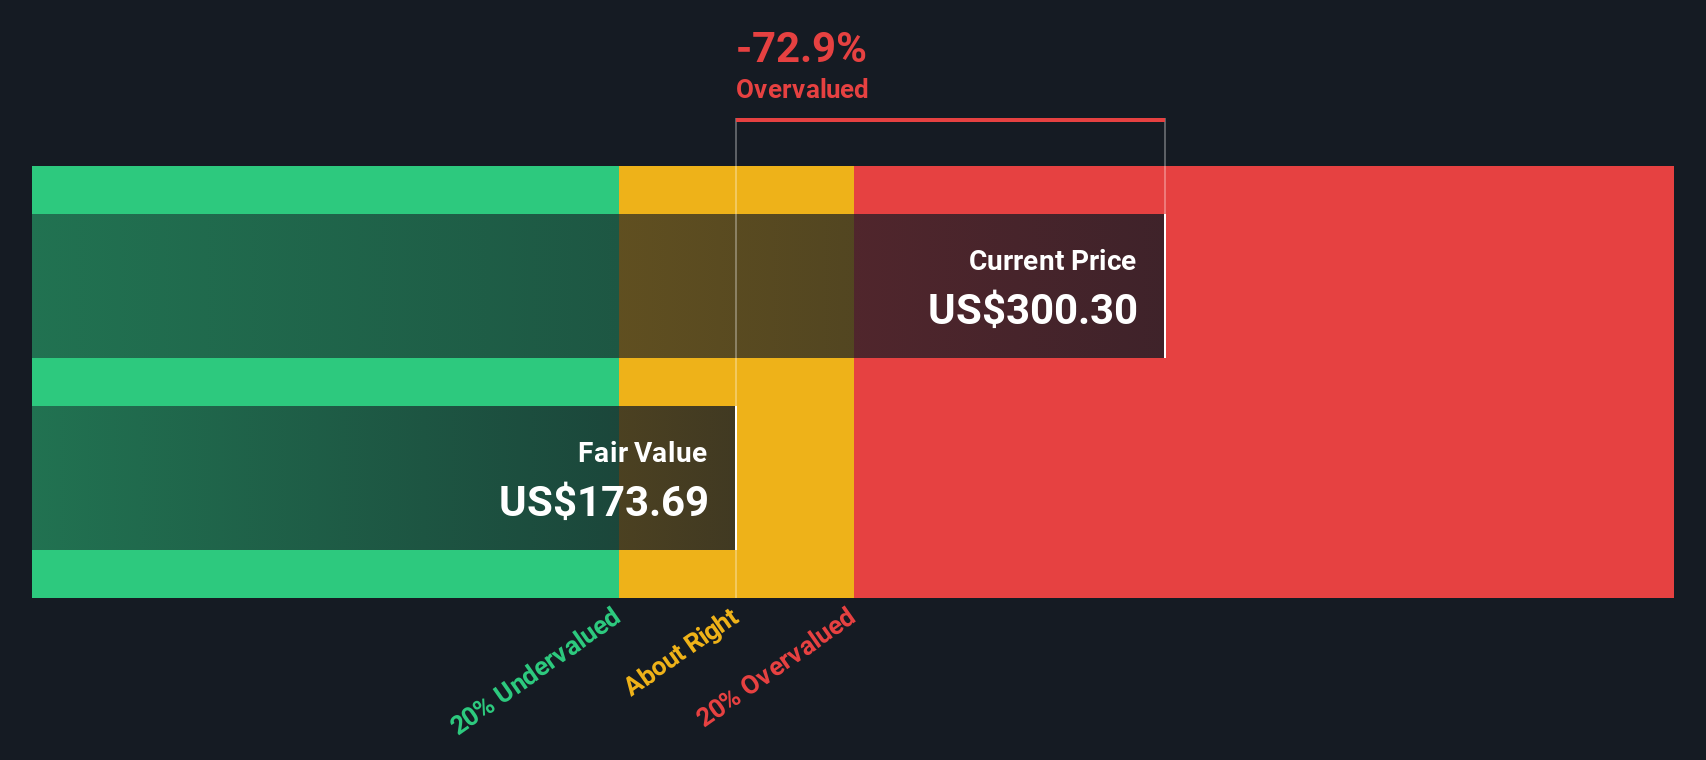
When all those projected cash flows are discounted back, the intrinsic value comes out at around $288 per share. That implies Broadcom is trading at roughly a 20.6% premium to this DCF estimate, which suggests the market is already pricing in very optimistic cash flow growth.
Result: OVERVALUED
Our Discounted Cash Flow (DCF) analysis suggests Broadcom may be overvalued by 20.6%. Discover 875 undervalued stocks or create your own screener to find better value opportunities.
Approach 2: Broadcom Price vs Earnings
For profitable, mature companies like Broadcom, the price to earnings ratio is often the most intuitive way to judge valuation because it directly links what investors pay today to the profits the business is generating.
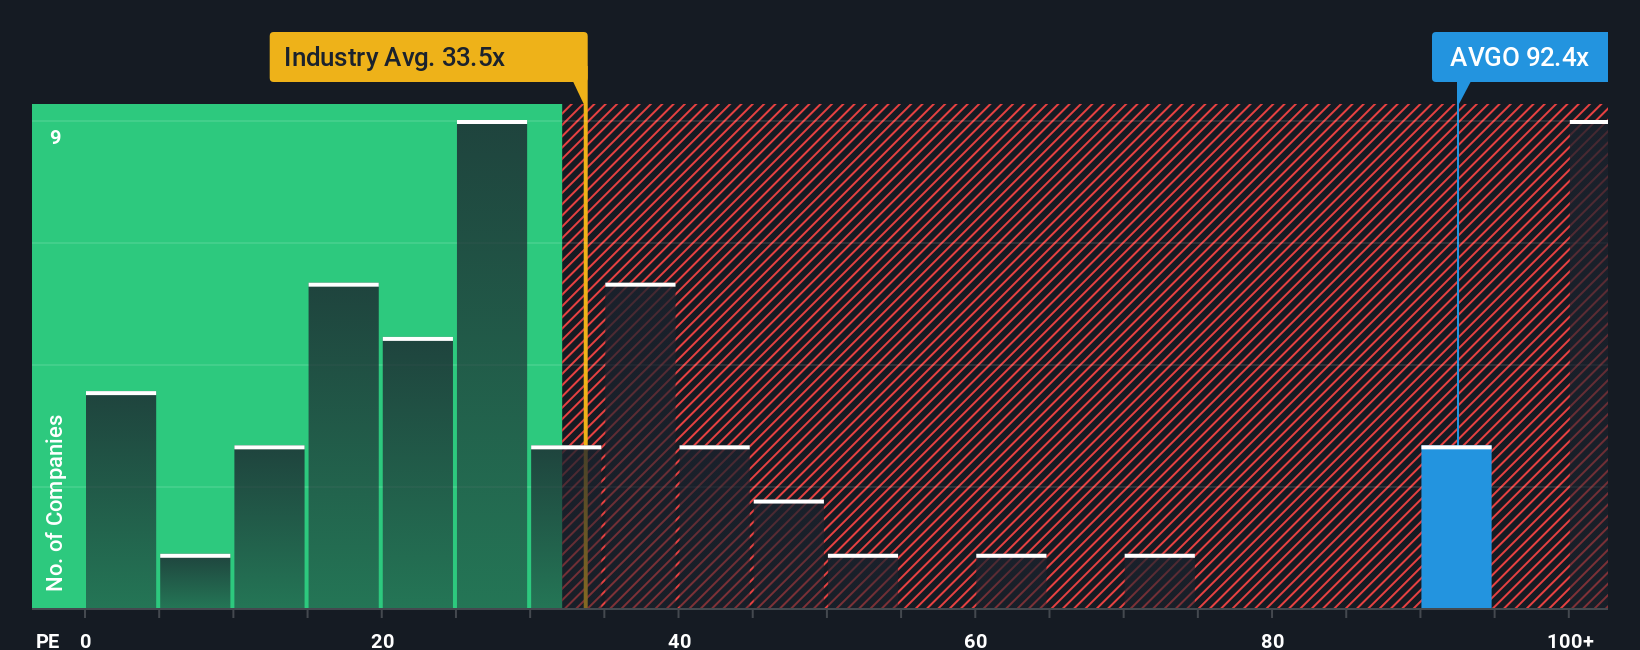
In simple terms, faster and more reliable earnings growth usually justifies a higher PE, while slower growth or higher risk should mean a lower, more conservative multiple. Broadcom currently trades on about 71.27x earnings, which is well above both the broader Semiconductor industry average of 37.31x and the peer group average of 56.36x. This implies investors are baking in very strong growth and relatively low risk.
Simply Wall St’s Fair Ratio framework goes a step further than those blunt comparisons. It estimates what a reasonable PE should be for Broadcom, given its specific earnings growth outlook, profitability, industry dynamics, size, and risk profile. On that basis, Broadcom’s Fair Ratio is 55.05x, which is materially below the current 71.27x market multiple. That gap suggests the shares are trading ahead of what its fundamentals would typically support, even after accounting for its strong growth narrative.
Result: OVERVALUED
PE ratios tell one story, but what if the real opportunity lies elsewhere? Discover 1464 companies where insiders are betting big on explosive growth.
Upgrade Your Decision Making: Choose your Broadcom Narrative
Earlier we mentioned that there is an even better way to understand valuation, so let us introduce you to Narratives, a simple framework that lets you attach a clear story to your numbers by connecting your assumptions about Broadcom’s future revenue, earnings, and margins to a financial forecast and then to a Fair Value estimate. On Simply Wall St’s Community page, millions of investors use Narratives as an easy tool to spell out why they think Broadcom deserves a certain multiple, compare that Fair Value to today’s price to decide whether it looks like a buy, hold, or sell, and then have those Narratives dynamically refreshed as new information such as earnings, AI customer wins, or risks including Apple’s in house chips and OpenAI’s custom silicon comes in. For example, one Broadcom Narrative might lean on the higher end of analyst assumptions, seeing accelerating AI demand, successful VMware integration, and a Fair Value closer to the most optimistic targets. A more cautious Narrative might focus on customer concentration, competition, and debt to arrive nearer the lowest targets, and Narratives make those differing perspectives explicit and comparable in one place.
Do you think there's more to the story for Broadcom? Head over to our Community to see what others are saying!
This article by Simply Wall St is general in nature. We provide commentary based on historical data and analyst forecasts only using an unbiased methodology and our articles are not intended to be financial advice. It does not constitute a recommendation to buy or sell any stock, and does not take account of your objectives, or your financial situation. We aim to bring you long-term focused analysis driven by fundamental data. Note that our analysis may not factor in the latest price-sensitive company announcements or qualitative material. Simply Wall St has no position in any stocks mentioned.
Have feedback on this article? Concerned about the content? Get in touch with us directly. Alternatively, email editorial-team@simplywallst.com