
Is It Too Late to Consider Teradyne After a 130.4% Three Year Surge?
- If you are wondering whether Teradyne is still attractively priced today, or if the big gains are already behind it, this article will unpack whether the current market optimism is actually justified by value.
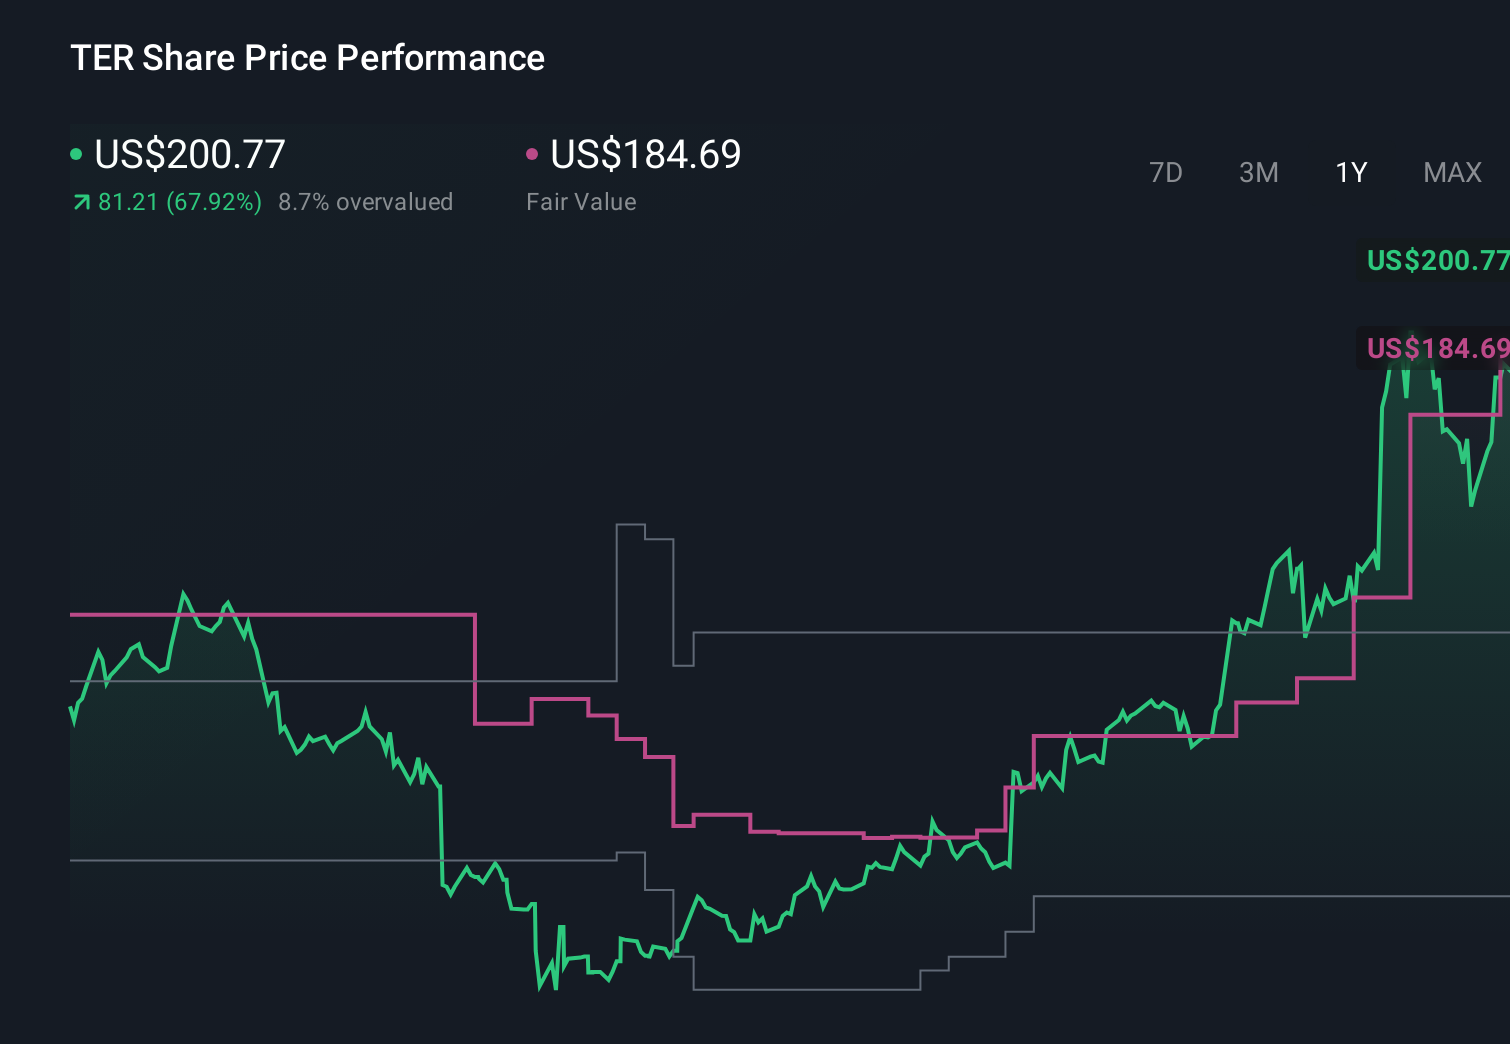
- The stock has climbed 4.4% over the last week and 3.4% over the past month, capping a powerful 59.6% gain over the last year and an impressive 130.4% over three years, while still sitting roughly flat year to date.
- Those moves have come as investors increase exposure to semiconductor and automation names benefiting from structural demand for testing equipment and factory robotics. At the same time, capital continues to chase high quality enablers of AI, advanced chips, and industrial automation. In parallel, the broader market debate around how much growth is already priced into leading chip ecosystem stocks has become more intense, putting valuation in sharp focus.
- Right now Teradyne scores just 0/6 on our valuation checks, suggesting that on traditional metrics it does not obviously screen as undervalued, but headline multiples are only part of the story. Next we will walk through the key valuation approaches, and then finish with a more powerful way to think about what Teradyne is really worth in the long run.
Teradyne scores just 0/6 on our valuation checks. See what other red flags we found in the full valuation breakdown.
Approach 1: Teradyne Discounted Cash Flow (DCF) Analysis
A Discounted Cash Flow model takes Teradyne's expected future cash flows and then discounts them back to today's dollars to estimate what the entire business is worth now. It is essentially asking how much investors should pay today for the cash the company is likely to generate in the future.
Teradyne currently generates about $485.6 Million in free cash flow. Analysts and extrapolated estimates see this rising steadily, with free cash flow projected to reach roughly $1.76 Billion by 2035, based on a 2 Stage Free Cash Flow to Equity model that blends near term analyst forecasts with longer term growth assumptions. All of these projections are in $ and are first forecast, then discounted to reflect risk and the time value of money.
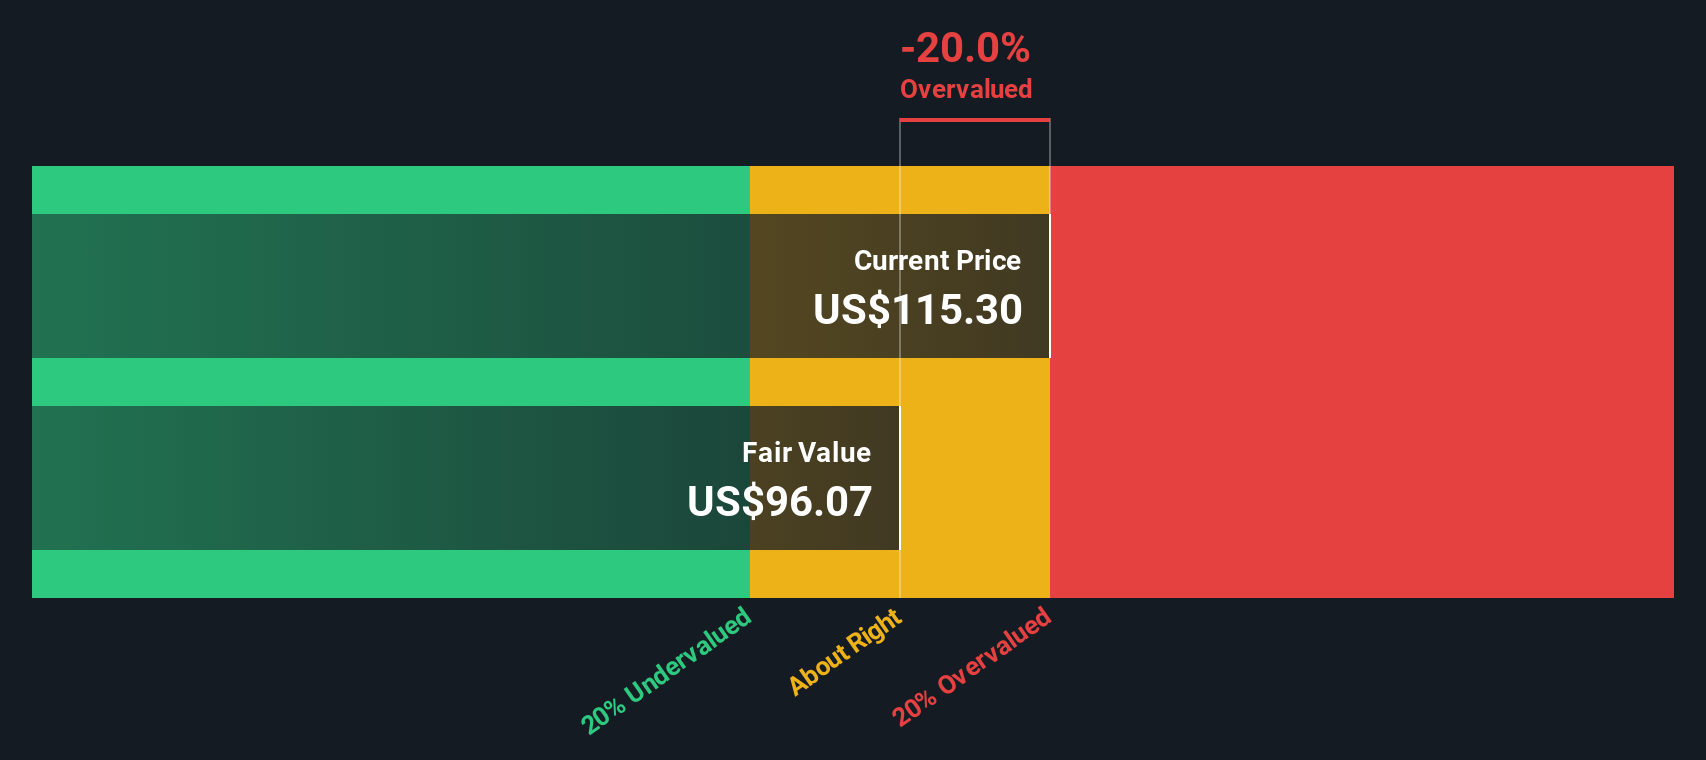
On this basis, the model arrives at an intrinsic value of about $106.35 per share. Compared with the current share price, the implied intrinsic discount suggests Teradyne is roughly 95.2% overvalued, indicating that a great deal of future growth is already priced in.
Result: OVERVALUED
Our Discounted Cash Flow (DCF) analysis suggests Teradyne may be overvalued by 95.2%. Discover 875 undervalued stocks or create your own screener to find better value opportunities.
Approach 2: Teradyne Price vs Earnings
For profitable, established businesses like Teradyne, the price to earnings (PE) ratio is a useful way to gauge whether investors are paying a reasonable price for each dollar of profit. A higher PE can be justified when a company is expected to grow earnings quickly or is seen as lower risk, while slower growth or higher risk usually calls for a lower, more conservative PE.
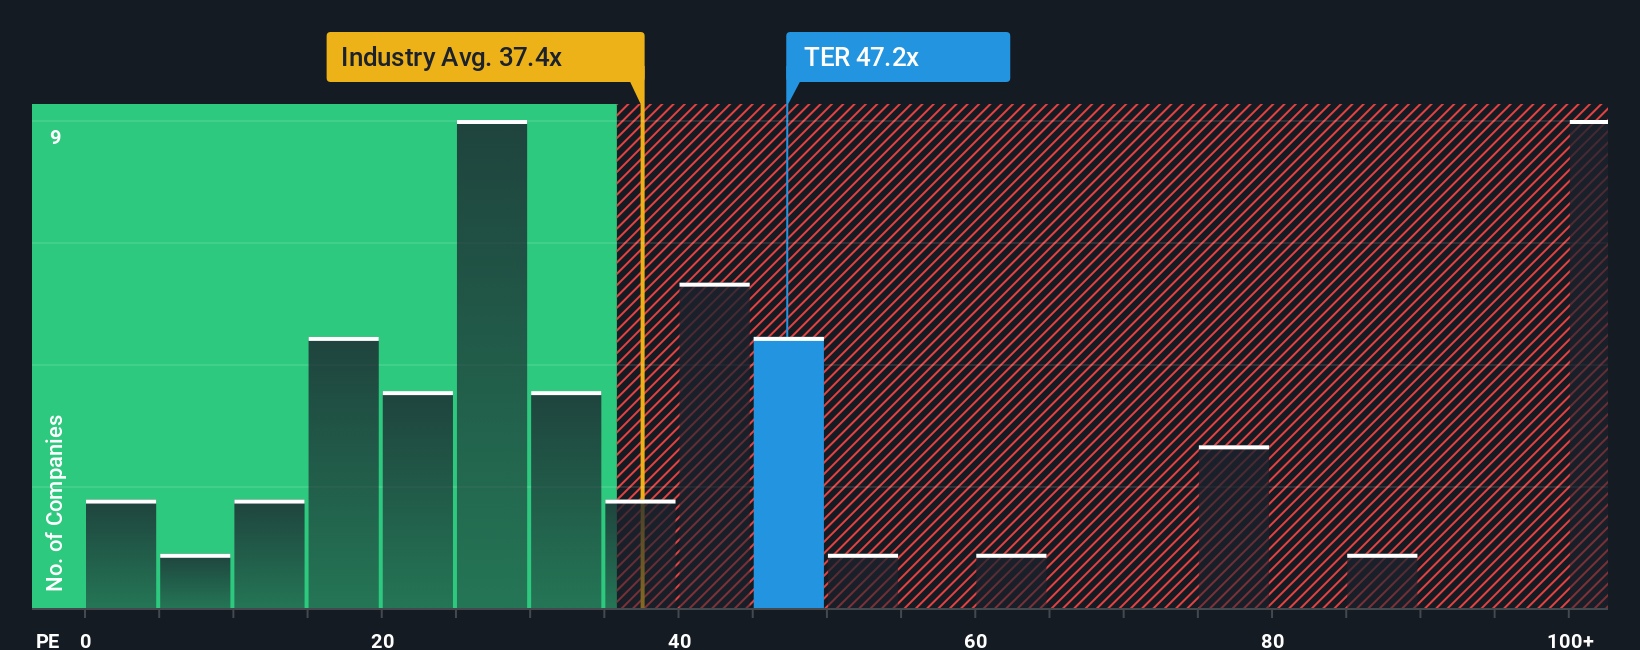
Teradyne currently trades on a PE of about 73.4x, which is well above both the Semiconductor industry average of roughly 37.3x and the broader peer group average of around 36.0x. To move beyond these blunt comparisons, Simply Wall St uses a proprietary Fair Ratio, which estimates what a normal PE should be after accounting for Teradyne’s specific growth outlook, profitability, industry positioning, size, and risk profile.
On this basis, Teradyne’s Fair Ratio is 41.7x, meaning the stock’s current 73.4x PE sits significantly above what would typically be warranted even after adjusting for its strengths. This suggests that, relative to its fundamentals and risk adjusted growth prospects, Teradyne looks expensive on an earnings multiple basis.
Result: OVERVALUED
PE ratios tell one story, but what if the real opportunity lies elsewhere? Discover 1464 companies where insiders are betting big on explosive growth.
Upgrade Your Decision Making: Choose your Teradyne Narrative
Earlier we mentioned that there is an even better way to understand valuation, so let us introduce you to Narratives, a simple framework where you write the story behind your numbers, linking your view of Teradyne’s future revenue, earnings, and margins to a financial forecast and, ultimately, a fair value estimate.
On Simply Wall St’s Community page, used by millions of investors, Narratives make this process accessible by guiding you to spell out why you think Teradyne will win or struggle, translate that story into explicit forecasts, and then compare the Fair Value implied by your Narrative with today’s share price so you can decide whether to buy, hold, or sell.
Because Narratives are updated dynamically as new information such as earnings, product launches, or macro news arrives, they stay current and help you continuously test your thesis instead of relying on static models.
For example, one Teradyne Narrative might lean bullish and assume AI testing demand and robotics expansion support a fair value closer to $192. Another more cautious Narrative might focus on tariffs and cyclicality and land nearer $85. By comparing where your own Narrative’s Fair Value sits between those views and today’s price, you can decide which story you believe and act accordingly.
Do you think there's more to the story for Teradyne? Head over to our Community to see what others are saying!
This article by Simply Wall St is general in nature. We provide commentary based on historical data and analyst forecasts only using an unbiased methodology and our articles are not intended to be financial advice. It does not constitute a recommendation to buy or sell any stock, and does not take account of your objectives, or your financial situation. We aim to bring you long-term focused analysis driven by fundamental data. Note that our analysis may not factor in the latest price-sensitive company announcements or qualitative material. Simply Wall St has no position in any stocks mentioned.
Have feedback on this article? Concerned about the content? Get in touch with us directly. Alternatively, email editorial-team@simplywallst.com