
Has the Market Fully Priced Google’s AI Push After a 65% Surge?
- If you are wondering whether Alphabet is still a smart buy at today’s price, or if most of the upside is already baked in, you are in the right place to unpack what the numbers really say about its value.
- Despite some short term noise, with the stock up 0.5% over the last week, down 1.9% over the last month, and roughly flat year to date, the focus for many investors is the 65.0% gain over the past year and a 263.6% return over three years that has reset expectations.
- Investor sentiment has been shaped by ongoing headlines around Alphabet’s AI rollout in Search and Workspace, continued performance in its core advertising platform, and regulatory scrutiny in the United States and Europe. Together, these developments have investors constantly reassessing whether the company is entering a new growth phase or facing a more volatile risk backdrop.
- On our framework, Alphabet scores a 3/6 valuation check. This suggests it appears undervalued on some measures but not across the board. Next, we break down the main valuation approaches investors use and then return to an alternative way to think about what the stock may be worth.
Approach 1: Alphabet Discounted Cash Flow (DCF) Analysis
A Discounted Cash Flow, or DCF, model estimates what a company is worth by projecting the cash it can generate in the future and then discounting those cash flows back to today’s dollars.
For Alphabet, the model used here is a 2 stage Free Cash Flow to Equity approach. The company generated roughly $92.6 billion in free cash flow over the last twelve months, and analysts expect this to continue growing strongly. Based on analyst inputs for the next few years, followed by extrapolated trends beyond that, free cash flow is projected to reach about $189.0 billion by 2030 in dollar terms.
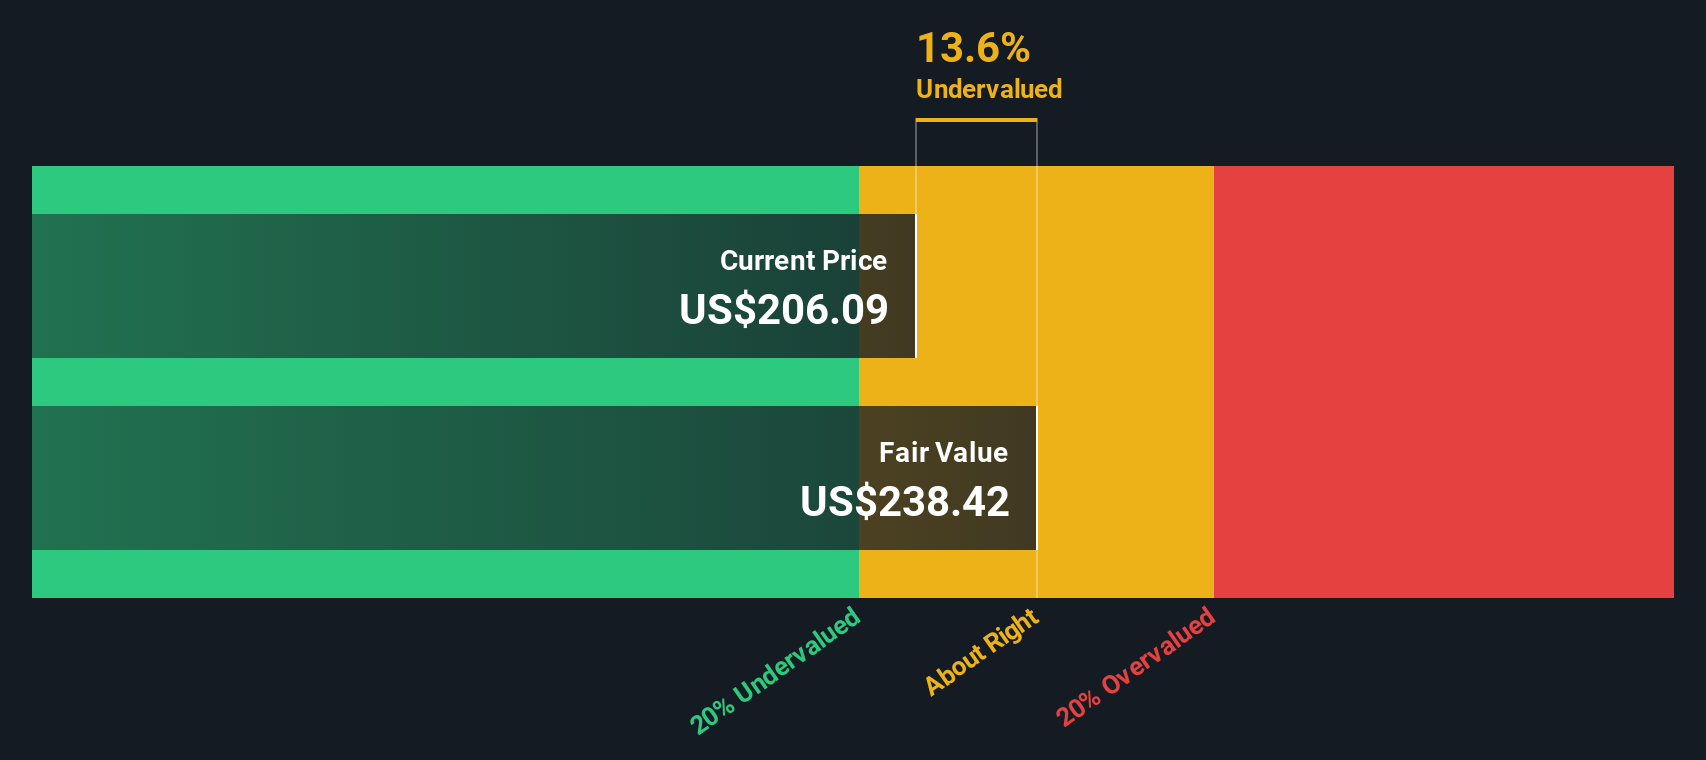
When all those future cash flows are discounted back, the DCF model arrives at an intrinsic value of about $315.45 per share. Compared with the current share price, this implies the stock is roughly 0.1% undervalued, which is effectively in line with the market’s view.
Result: ABOUT RIGHT
Alphabet is fairly valued according to our Discounted Cash Flow (DCF), but this can change at a moment's notice. Track the value in your watchlist or portfolio and be alerted on when to act.
Approach 2: Alphabet Price vs Earnings
For a mature, consistently profitable business like Alphabet, the price to earnings (PE) ratio is a practical way to judge valuation because it relates what investors pay for each dollar of current earnings. In general, faster growth and lower perceived risk justify a higher PE, while slower growth or higher risk should pull a normal or fair PE down.
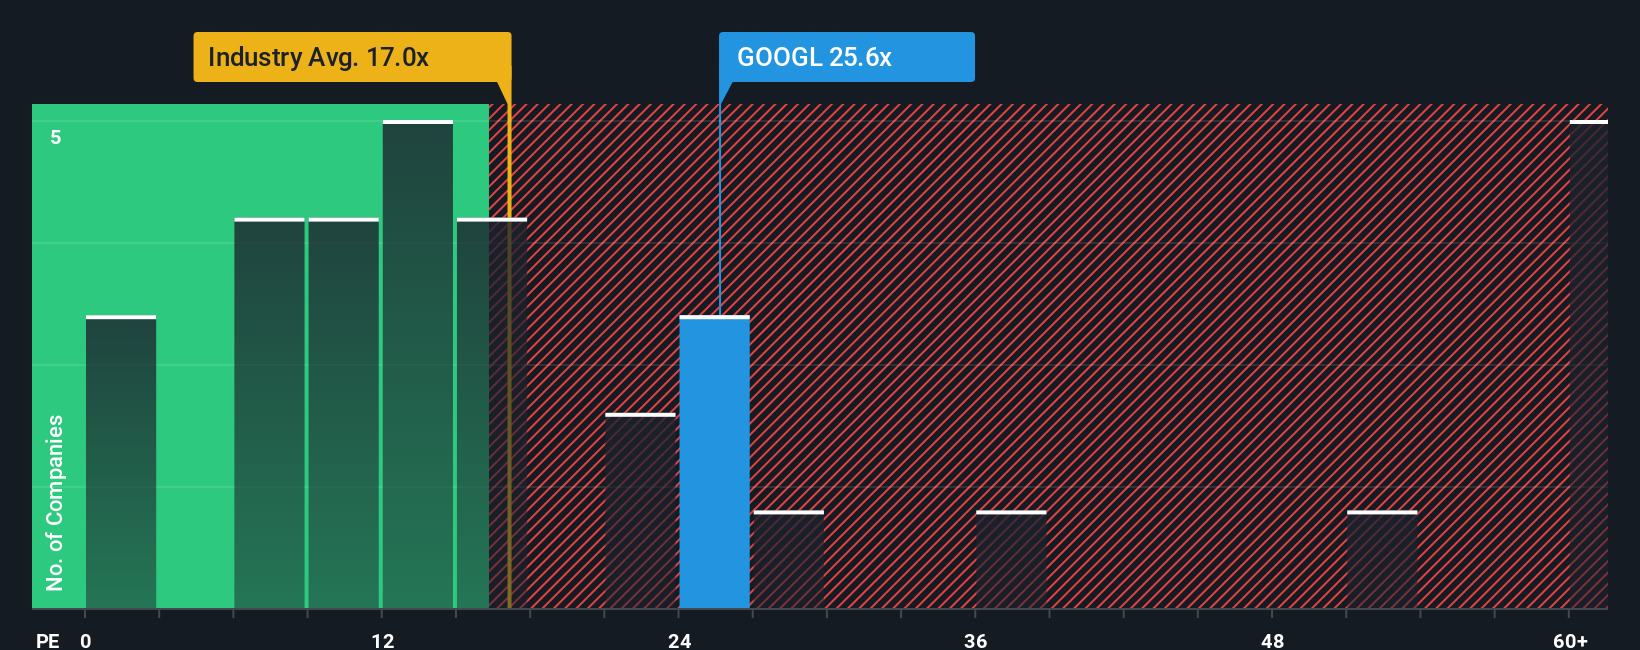
Alphabet currently trades on a PE of about 30.6x. That is roughly double the broader Interactive Media and Services industry average of around 15.5x, but still at a discount to a peer group that trades closer to 52.8x. To move beyond these blunt comparisons, Simply Wall St uses a Fair Ratio, an estimate of what Alphabet’s PE “should” be once its earnings growth, industry, profit margins, market value and risk profile are all factored in.
This Fair Ratio for Alphabet is 39.7x, meaning this framework suggests the company is assigned a lower multiple by the market than this estimate. Because 39.7x is meaningfully above the current 30.6x, the PE lens indicates Alphabet’s shares appear attractively priced relative to their fundamentals.
Result: UNDERVALUED
PE ratios tell one story, but what if the real opportunity lies elsewhere? Discover 1464 companies where insiders are betting big on explosive growth.
Upgrade Your Decision Making: Choose your Alphabet Narrative
Earlier we mentioned that there is an even better way to understand valuation, so let us introduce you to Narratives, a simple way to connect your view of Alphabet’s story to your own financial forecast and an estimate of fair value that you can easily compare to today’s share price.
On Simply Wall St’s Community page, Narratives let investors describe their thesis in plain language, then tie it to assumptions for future revenue, earnings and margins, so that the story you believe in is directly linked to a dynamic valuation rather than sitting separate from the numbers.
Because Narratives automatically refresh when new information like earnings, product updates or macro news arrives, they give you an up to date fair value that can support real decisions. For example, Alphabet may appear more attractive to you when your Narrative fair value is $212 per share, or closer to fully priced when another investor’s Narrative implies $340, even while the market trades at a different level in between.
For Alphabet, we’ll make it really easy for you with previews of two leading Alphabet narratives.
Fair value in this narrative: $340.00 per share
Implied undervaluation vs today’s price: 7.3%
Revenue growth assumption: 17.36%
- Alphabet’s digital ad dominance, plus a now profitable Google Cloud and embedded AI capabilities, supports a structurally higher future earnings base.
- Buffett and Berkshire involvement is framed as a long term quality signal that could justify a higher future P E multiple and a valuation re rating.
- A fortress balance sheet, powerful cash generation and a portfolio of AI, Cloud and moonshot bets position Alphabet as an innovation platform priced like a mature company.
Fair value in this narrative: $212.34 per share
Implied overvaluation vs today’s price: 48.4%
Revenue growth assumption: 13.47%
- Digital advertising, Cloud and AI are all expected to keep growing, but the narrative argues that current optimism and multiples already bake in much of this upside.
- High costs for generative AI, regulatory uncertainty and heavy reliance on ad revenues could cap profitability and justify a lower fair value than the market price.
- Even with solid long term tailwinds and improving margins, the narrative sees Alphabet as a steady compounder rather than a bargain, leaving limited margin of safety at current levels.
Do you think there's more to the story for Alphabet? Head over to our Community to see what others are saying!

This article by Simply Wall St is general in nature. We provide commentary based on historical data and analyst forecasts only using an unbiased methodology and our articles are not intended to be financial advice. It does not constitute a recommendation to buy or sell any stock, and does not take account of your objectives, or your financial situation. We aim to bring you long-term focused analysis driven by fundamental data. Note that our analysis may not factor in the latest price-sensitive company announcements or qualitative material. Simply Wall St has no position in any stocks mentioned.
Have feedback on this article? Concerned about the content? Get in touch with us directly. Alternatively, email editorial-team@simplywallst.com