
Assessing American Airlines Group (AAL) Valuation After Earnings Beat And Upgraded Guidance
American Airlines Group (AAL) recently reported quarterly results that exceeded analysts' EPS estimates, along with guidance above expectations, and the stock has climbed about 26.4% since that earnings release.
See our latest analysis for American Airlines Group.
The earnings beat and confident guidance have come on top of a 32.76% 90 day share price return to $15.48, although the 1 year total shareholder return of 11.64% decline shows longer term holders have had a tougher run. Recent commentary around full service U.S. carriers, including American Airlines Group, has also drawn attention to balance sheet strength and margins, which may be influencing how investors assess both growth potential and risk.
If this kind of rebound in airline sentiment has you looking wider, it could be a good moment to scan other aerospace and defense stocks that might fit your watchlist.
With American Airlines Group trading near its recent gains but still showing an indicated intrinsic discount, the key question is simple: are you looking at an undervalued full service carrier, or is the market already pricing in future growth?
Most Popular Narrative: 45.9% Overvalued
According to PittTheYounger, the narrative fair value of American Airlines Group sits well below the recent US$15.48 close, which sets a very different tone to the current rebound and puts the focus firmly on balance sheet pressure.
There's a single reason why American is the least attractive of US legacy carriers (in terms of investing, anyway): its balance sheet. If most airlines and certainly those in the US are loaded up to the hilt with debt, American goes so far as to boast negative equity. Any startup would go belly-up with a balance sheet such as this one. Now, you can survive and even generate decent returns with a precarious capital structure, but of course you're super sensitive to any shock on the demand side of your business, hitting both revenues and margins, and that is where the clouds gather on American. After the industry's recent warnings re falling travel demand, the already cut-throat competition for market share will get yet more intensive, while margins will inevitably come under pressure. I fail to see why American might be an attractive investment proposition outside of the rosiest of economic outlooks, which is not what's at hand right now.
Curious how a low single digit profit margin, a premium future P/E and a double digit discount rate combine into that fair value? The full narrative walks through the revenue runway, margin assumptions and the earnings multiple that underpin this view.
Result: Fair Value of $10.61 (OVERVALUED)
Have a read of the narrative in full and understand what's behind the forecasts.
However, this view could be challenged if refinancing terms stay supportive for longer than expected, or if premium cabins consistently lift revenue per seat more than feared.
Find out about the key risks to this American Airlines Group narrative.
Another View: Multiples Point The Other Way
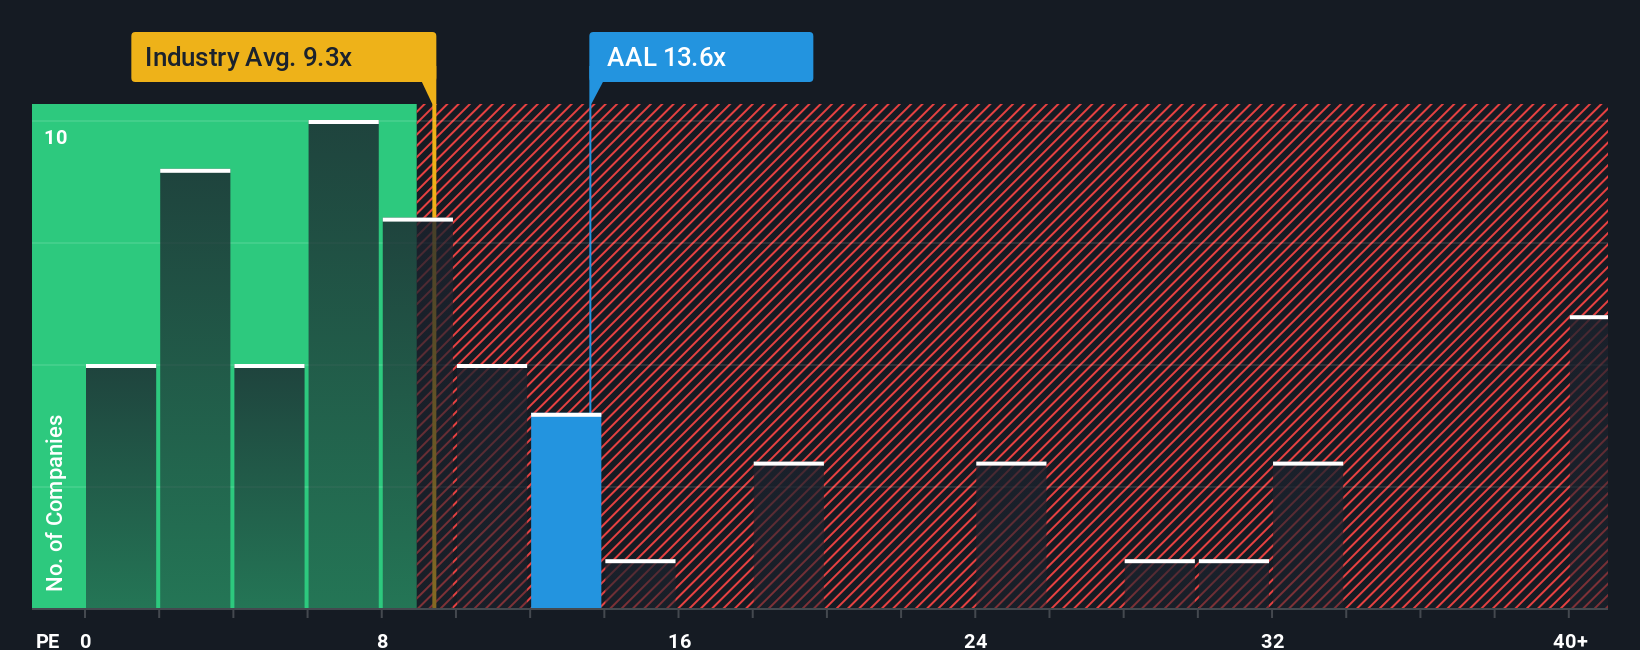
That 45.9% overvalued narrative sits oddly next to Simply Wall St's own checks, which show American Airlines Group trading at a P/E of 17x compared with a fair ratio of 24.5x. It also screens as expensive versus the global airlines average P/E of 9.5x, yet cheaper than peers at 28.3x. Is this a margin-of-safety opportunity or a value trap tied to balance sheet risk?
See what the numbers say about this price — find out in our valuation breakdown.
Build Your Own American Airlines Group Narrative
If you see the numbers differently, you can stress test every assumption yourself, shape the story to your view, and Do it your way in under three minutes.
A great starting point for your American Airlines Group research is our analysis highlighting 3 key rewards and 2 important warning signs that could impact your investment decision.
Looking for more investment ideas?
If you only stop at one airline, you could miss other opportunities, so use the Simply Wall St Screener to quickly spot ideas that fit your style.
- Hunt for potential mispriced opportunities by scanning these 875 undervalued stocks based on cash flows that may offer more appealing entry points.
- Tap into the growth story in artificial intelligence by checking out these 25 AI penny stocks shaping how data and automation show up across sectors.
- Add a different source of potential returns by reviewing these 14 dividend stocks with yields > 3% that focus on cash returns to shareholders.
This article by Simply Wall St is general in nature. We provide commentary based on historical data and analyst forecasts only using an unbiased methodology and our articles are not intended to be financial advice. It does not constitute a recommendation to buy or sell any stock, and does not take account of your objectives, or your financial situation. We aim to bring you long-term focused analysis driven by fundamental data. Note that our analysis may not factor in the latest price-sensitive company announcements or qualitative material. Simply Wall St has no position in any stocks mentioned.
Have feedback on this article? Concerned about the content? Get in touch with us directly. Alternatively, email editorial-team@simplywallst.com