
Is CoreWeave (CRWV) Pricing Fair After Recent Share Price Swings And AI Cloud Coverage
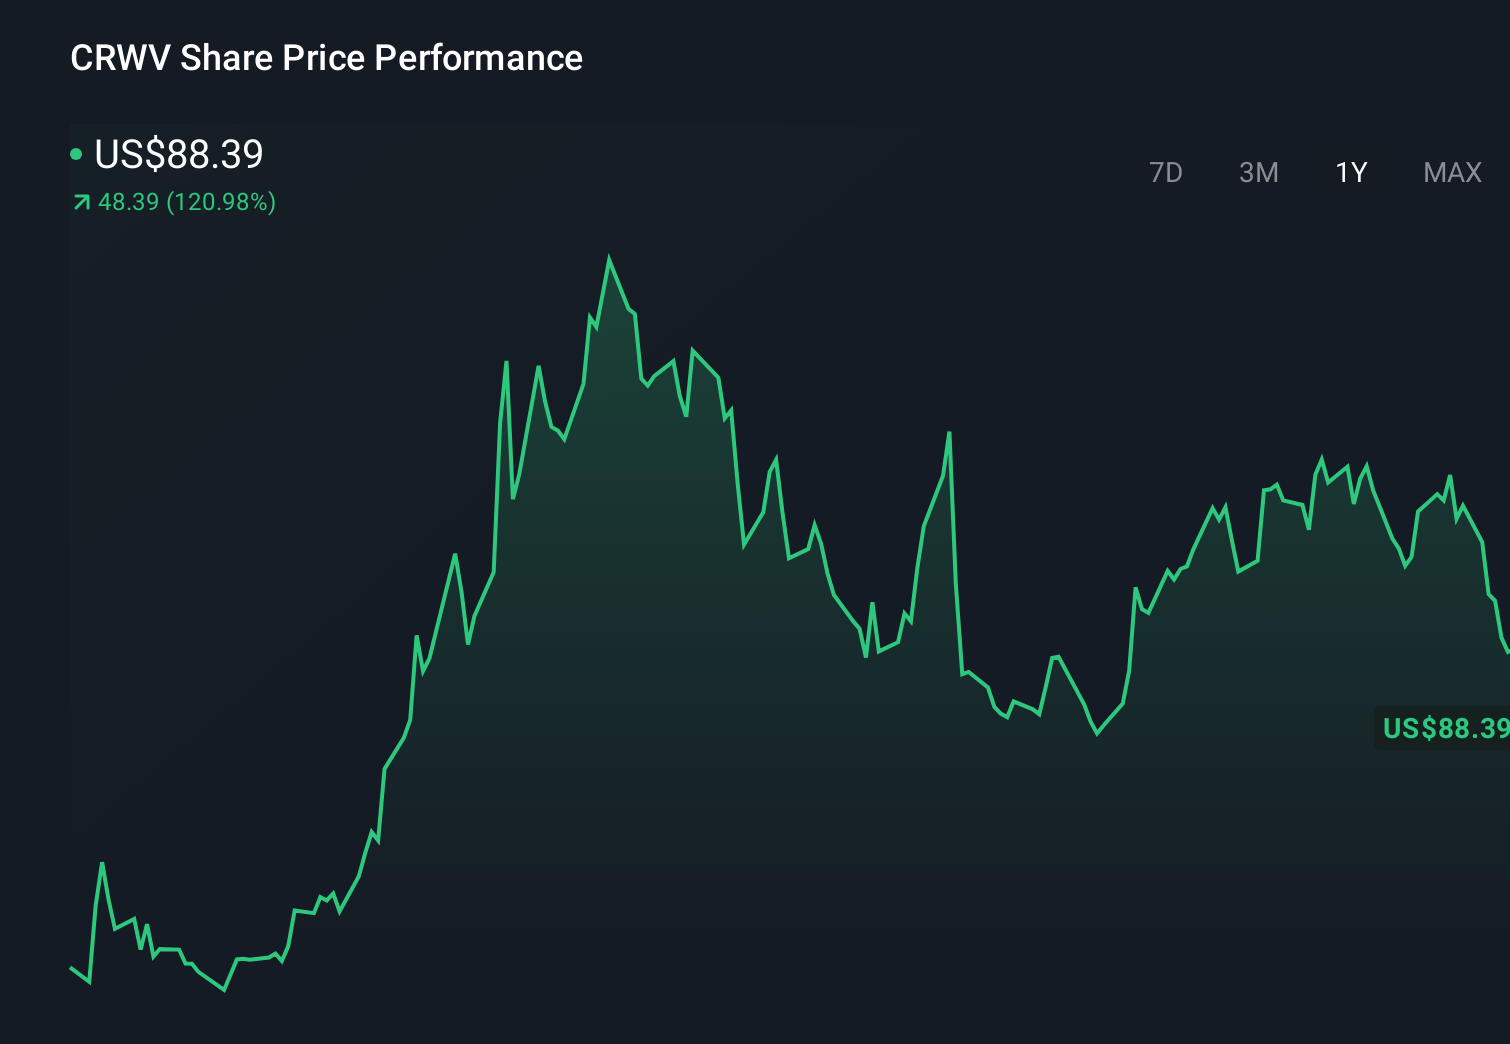
- If you are wondering whether CoreWeave at around US$79.32 offers good value today, you are not alone. This article is aimed at helping you frame that question clearly.
- Over the last week the stock returned 5.9%. However, over 30 days it recorded a 10.2% decline, which may catch the eye of investors thinking about growth potential or shifts in perceived risk.
- Recent coverage around CoreWeave has focused on its role in AI focused cloud infrastructure and how that positioning fits into broader demand for high performance computing. This has given investors more context for the recent share price swings and sharpened interest in what a fair price for the stock might look like.
- Right now our valuation checks give CoreWeave a score of 2 out of 6. We will unpack this using several valuation approaches, and later in the article we will look at a framework that can help you go beyond the headline numbers.
CoreWeave scores just 2/6 on our valuation checks. See what other red flags we found in the full valuation breakdown.
Approach 1: CoreWeave Discounted Cash Flow (DCF) Analysis
A Discounted Cash Flow, or DCF, model takes forecasts of a company’s future cash flows and discounts them back to today using a required rate of return, to arrive at an estimate of what the business might be worth per share.
For CoreWeave, the model used is a 2 Stage Free Cash Flow to Equity approach. The latest twelve month free cash flow is a cash outflow of about $12,020.81 million, so the starting point is firmly in loss making territory. Analyst and extrapolated projections in the model show free cash flow remaining negative in the near term, with values such as $18,709.65 million and $7,546.50 million in projected outflows, before shifting to a positive $1,203 million by 2030, all in $ and mostly in the hundreds or tens of thousands of millions range rather than in the billions.
When these projected cash flows are discounted back and added up, the model arrives at an estimated intrinsic value of about $31.95 per share. Against a current share price of around $79.32, this implies the stock is assessed as 148.2% overvalued on this DCF view.
Result: OVERVALUED
Our Discounted Cash Flow (DCF) analysis suggests CoreWeave may be overvalued by 148.2%. Discover 867 undervalued stocks or create your own screener to find better value opportunities.
Approach 2: CoreWeave Price vs Sales
For companies where earnings are limited or volatile, the P/S ratio is often a useful way to think about value because it compares the market value directly to the revenue the business is generating. What counts as a reasonable P/S depends a lot on how fast investors expect that revenue to grow and how much risk they see in the business model, since higher growth and lower perceived risk can justify paying a higher multiple of sales.
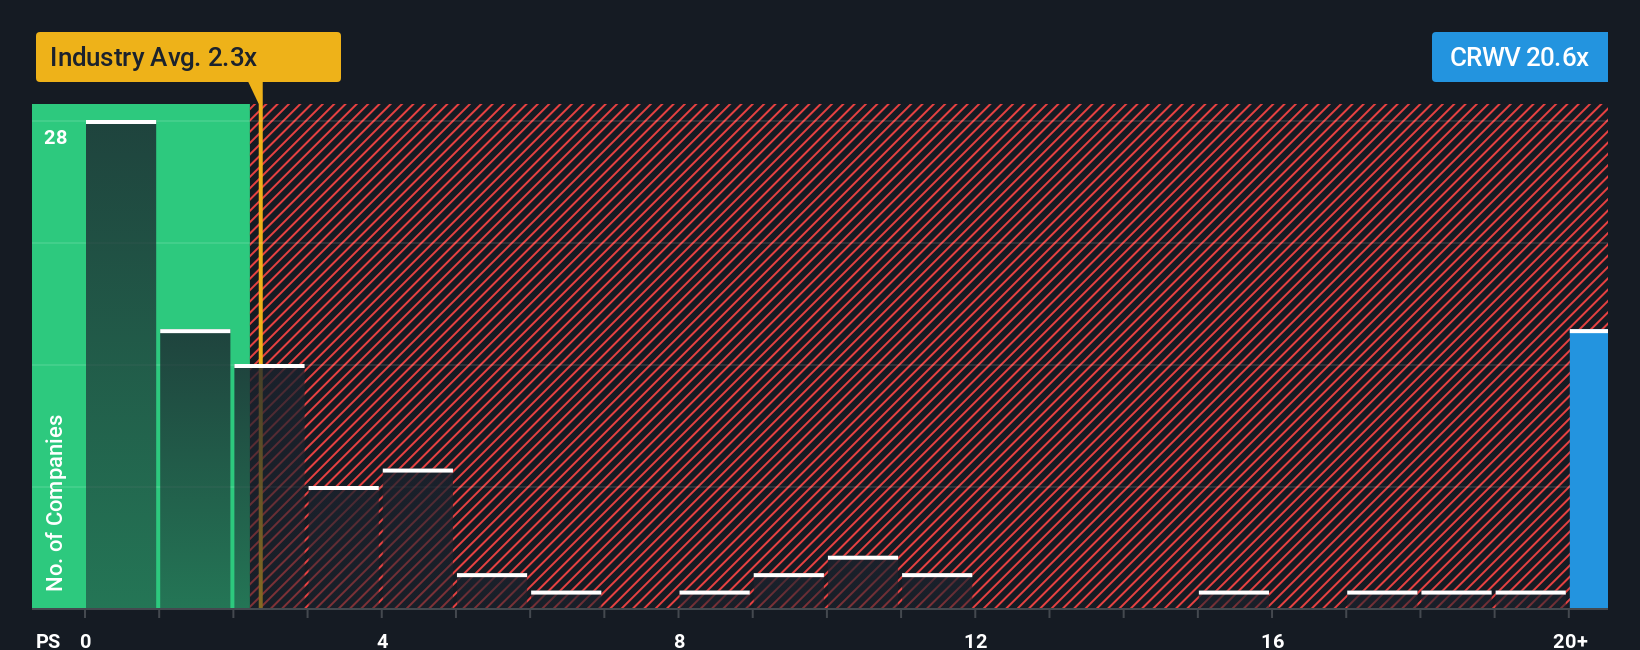
CoreWeave is currently trading on a P/S of 9.18x. That sits well above the broader IT industry average P/S of 2.24x. Its peer group for this metric sits at 17.33x. Simply Wall St’s Fair Ratio for CoreWeave, which is 25.83x, goes a step further. It is a proprietary estimate of what P/S might make sense after accounting for factors like earnings growth, profit margins, risks, market cap and the company’s industry, rather than just comparing to blunt sector or peer averages.
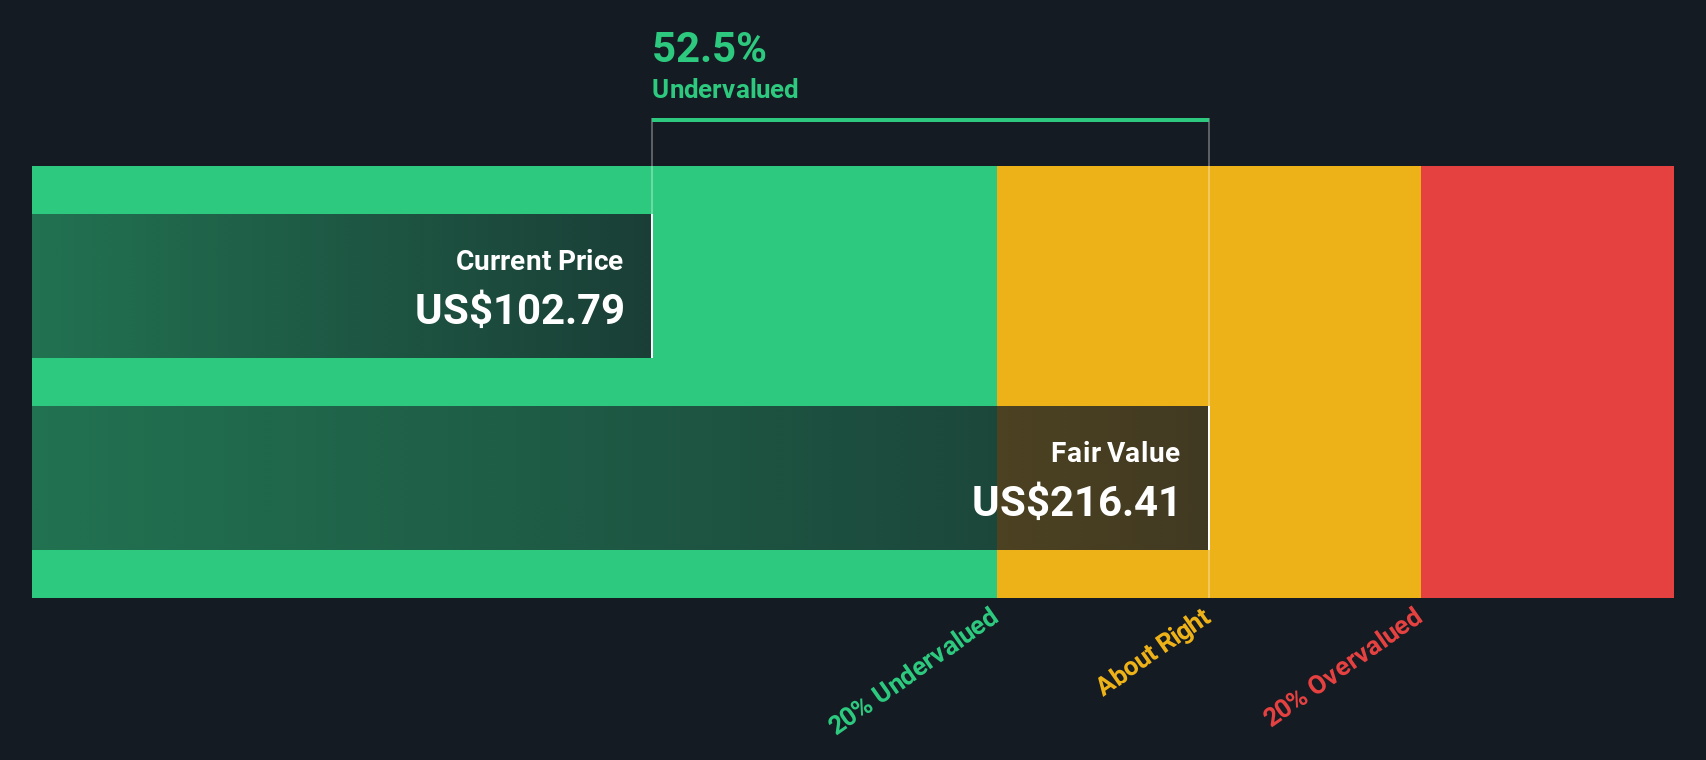
Comparing CoreWeave’s current 9.18x P/S to the 25.83x Fair Ratio suggests the shares screen as undervalued on this metric.
Result: UNDERVALUED
P/S ratios tell one story, but what if the real opportunity lies elsewhere? Discover 1464 companies where insiders are betting big on explosive growth.
Upgrade Your Decision Making: Choose your CoreWeave Narrative
Earlier we mentioned that there is an even better way to understand valuation, so let us introduce you to Narratives, which are simply your story about a company linked directly to your numbers for fair value, future revenue, earnings and margins.
Instead of just looking at a single DCF or P/S output, a Narrative connects what you believe about CoreWeave’s business, industry position and risks to a financial forecast and then to a fair value that you can compare with today’s share price.
You can create and explore Narratives on Simply Wall St’s Community page, where millions of investors share how their assumptions translate into Fair Value estimates. This can make it easier to spot when your view of CoreWeave implies a Price that looks high or low versus what you think it is worth.
Narratives are updated when new information like news or earnings is added. For CoreWeave you might see one investor using cautious revenue and margin assumptions that produce a relatively low Fair Value, while another uses more optimistic inputs that produce a much higher Fair Value, showing how different stories can sit side by side on the same stock.
Do you think there's more to the story for CoreWeave? Head over to our Community to see what others are saying!
This article by Simply Wall St is general in nature. We provide commentary based on historical data and analyst forecasts only using an unbiased methodology and our articles are not intended to be financial advice. It does not constitute a recommendation to buy or sell any stock, and does not take account of your objectives, or your financial situation. We aim to bring you long-term focused analysis driven by fundamental data. Note that our analysis may not factor in the latest price-sensitive company announcements or qualitative material. Simply Wall St has no position in any stocks mentioned.
Have feedback on this article? Concerned about the content? Get in touch with us directly. Alternatively, email editorial-team@simplywallst.com