
Is ASML Holding (NasdaqGS:ASML) Pricing In Too Much Future Semiconductor Demand?
- For investors wondering whether ASML Holding's current share price lines up with its underlying worth, this article walks through what the numbers are actually saying about value.
- The stock last closed at US$1,163.78, with returns of 9.2% over the last 7 days, 5.8% over the last 30 days, 52.7% over 1 year and 91.7% over 3 years, while the 5 year return stands at 138.1%.
- Recent attention on ASML Holding has centered on its role as a key equipment supplier in the semiconductor supply chain and how that position relates to long term demand for chipmaking capacity. This backdrop helps frame how investors are considering both the upside potential and the risks that are now being priced into the stock.
- Our Simply Wall St valuation model currently gives ASML Holding a valuation score of 1 out of 6. Next we look at what different valuation approaches indicate about that figure, before finishing with a way to put all these methods into a more useful, big picture view.
ASML Holding scores just 1/6 on our valuation checks. See what other red flags we found in the full valuation breakdown.
Approach 1: ASML Holding Discounted Cash Flow (DCF) Analysis
A Discounted Cash Flow, or DCF, model takes the cash a company is expected to generate in the future and discounts those amounts back to today to estimate what the business could be worth now.
For ASML Holding, the model used is a 2 Stage Free Cash Flow to Equity approach, based on cash flows in euros. The latest twelve month free cash flow is about €8.56b. Analyst based projections and subsequent extrapolations by Simply Wall St extend out to 2035, with forecast free cash flow for 2030 of €20.62b. Each of these future cash flows is discounted to reflect the time value of money and uncertainty over longer horizons.
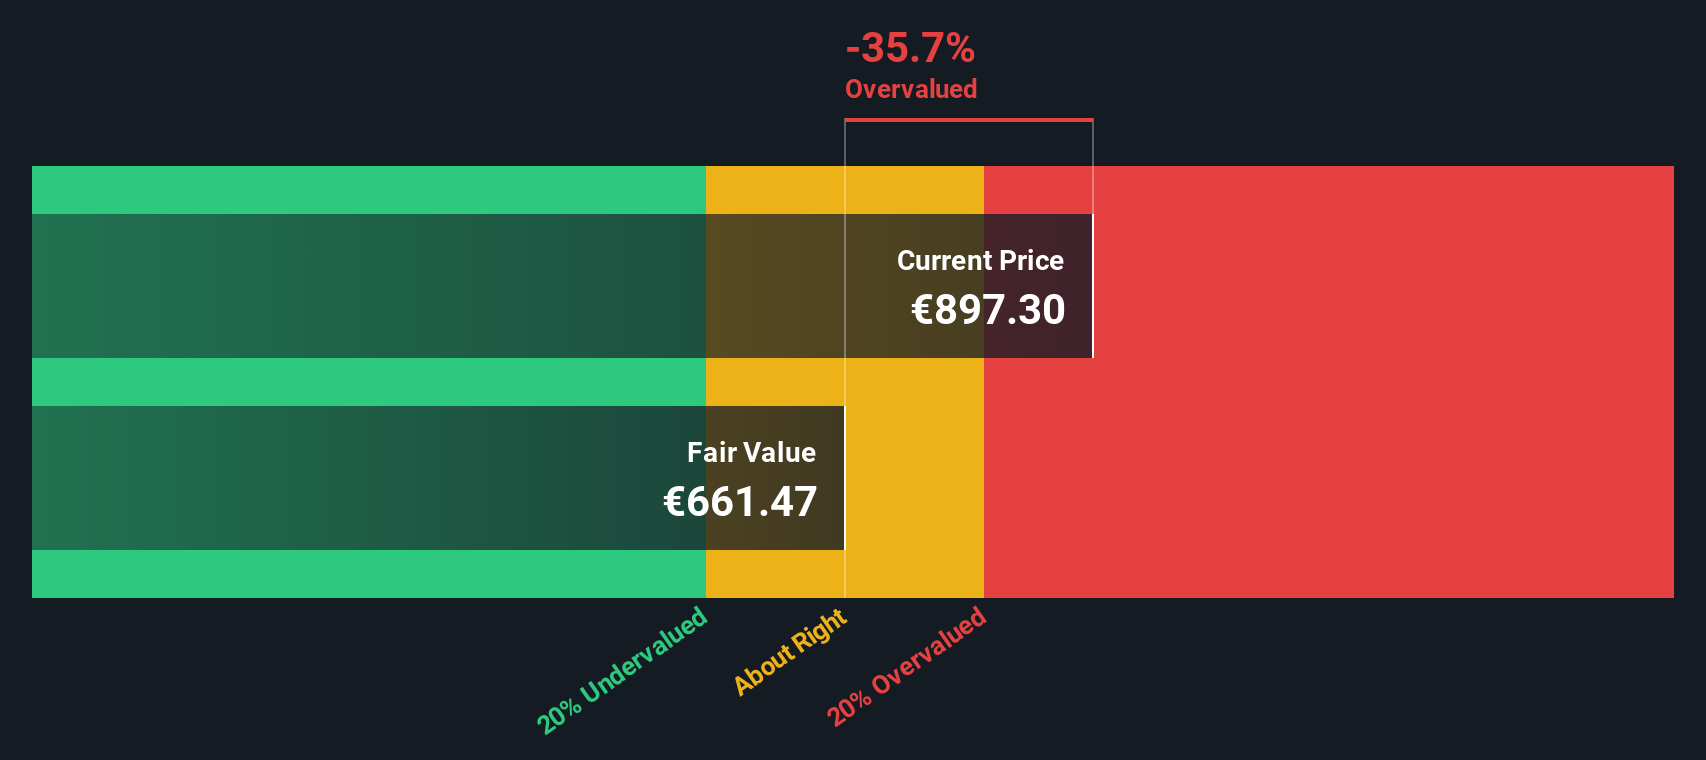
When all projected and discounted cash flows are added together, the model arrives at an estimated intrinsic value of about €926.99 per share. Compared with the recent share price of US$1,163.78, this implies the stock is about 25.5% above the DCF based estimate of value, so the model points to the shares being overvalued on this measure.
Result: OVERVALUED
Our Discounted Cash Flow (DCF) analysis suggests ASML Holding may be overvalued by 25.5%. Discover 867 undervalued stocks or create your own screener to find better value opportunities.
Approach 2: ASML Holding Price vs Earnings
For a profitable company like ASML Holding, the P/E ratio is a useful yardstick because it links what you pay for the stock to the earnings the business is already generating. It also reflects what the market is willing to pay for each unit of profit today.
Growth expectations and risk matter here. Higher expected earnings growth or lower perceived risk can justify a higher, or more elevated, P/E ratio, while slower growth or higher risk usually points to a lower P/E being more reasonable.
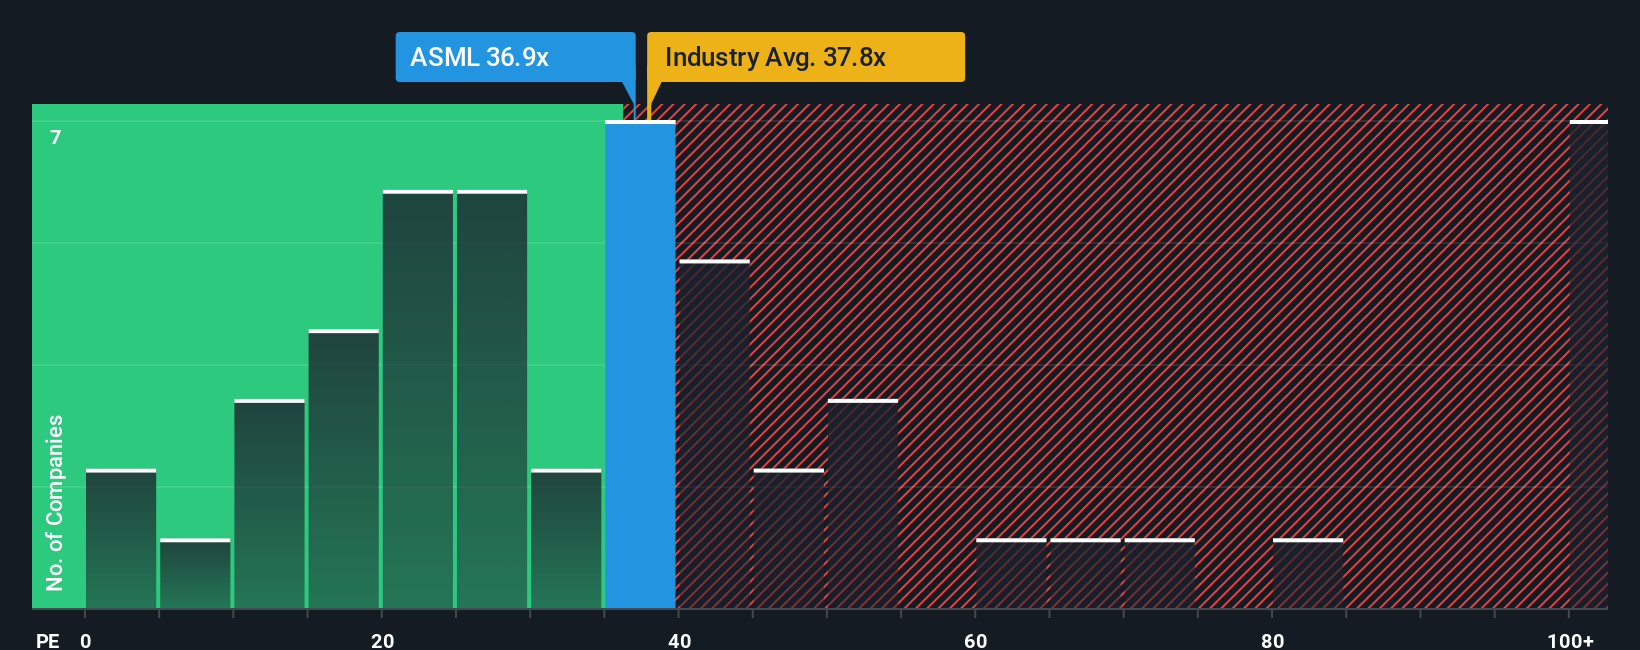
ASML Holding currently trades on a P/E of 40.36x. That sits above the Semiconductor industry average of 37.31x but below the peer average of 45.84x. Simply Wall St also calculates a proprietary “Fair Ratio” of 32.34x. This Fair Ratio is designed to reflect what might be a more fitting P/E for ASML Holding, given factors such as its earnings growth profile, industry, profit margins, market cap and company specific risks.
Because the Fair Ratio blends these company specific inputs, it can offer a more tailored reference point than a simple comparison with peers or the broader industry. With the current P/E of 40.36x sitting well above the Fair Ratio of 32.34x, this approach suggests that the shares may be trading at a relatively expensive valuation on a P/E basis.
Result: POTENTIALLY OVERVALUED ON P/E
P/E ratios tell one story, but what if the real opportunity lies elsewhere? Discover 1464 companies where insiders are betting big on explosive growth.
Upgrade Your Decision Making: Choose your ASML Holding Narrative
Earlier we mentioned that there is an even better way to understand valuation, so let us introduce you to Narratives, which let you attach a clear story about ASML Holding to the numbers you care about, such as your fair value estimate and your assumptions for future revenue, earnings and margins.
A Narrative connects three things in a straight line: how you see the business today, what that means for a simple financial forecast, and the fair value that drops out of those assumptions.
On Simply Wall St, Narratives are available on the Community page, where millions of investors share these story plus numbers views. The platform then compares each Narrative fair value with the current share price to help you decide whether the stock looks cheap, reasonable or expensive for your own approach.
Because Narratives on the platform refresh when new information such as news or earnings comes in, your view on ASML Holding can stay current rather than fixed to a past report. You can also see how different investors land at very different fair values. For example, one Narrative on ASML Holding currently sits around US$1,002.53 while others sit meaningfully higher or lower based on their assumptions.
Do you think there's more to the story for ASML Holding? Head over to our Community to see what others are saying!

This article by Simply Wall St is general in nature. We provide commentary based on historical data and analyst forecasts only using an unbiased methodology and our articles are not intended to be financial advice. It does not constitute a recommendation to buy or sell any stock, and does not take account of your objectives, or your financial situation. We aim to bring you long-term focused analysis driven by fundamental data. Note that our analysis may not factor in the latest price-sensitive company announcements or qualitative material. Simply Wall St has no position in any stocks mentioned.
Have feedback on this article? Concerned about the content? Get in touch with us directly. Alternatively, email editorial-team@simplywallst.com