China Association of Listed Companies: The total market value of listed companies in 2025 increased 22.5% year-on-year
Zhitong Finance App learned that on January 5, the China Association of Listed Companies released the 2025 A-share listed companies' market capitalization performance report. As of December 31, 2025, the Shanghai Composite Index grew from 3351.76 points in early 2025 to 3968.84 points, up 18.4% year on year; at the end of 2025, there were 5,469 A-share listed companies, with a total market value of 123 trillion yuan, of which 116 new listed companies were added in 2025, 5,353 stock companies listed before January 1, 2025, and the total market value of listed companies increased 22.5% year on year in 2025.
I. Overall market value performance of listed companies
In 2025, China's market value management system moved from conceptual promotion to institutionalization, systematization, and practice. The capital market showed the following characteristics and trends:
First, market value performance reflects the country's strategic direction. In 2025, in emerging industries and key areas involving the national strategy, such as integrated circuits, artificial intelligence, high-end manufacturing, and biomantry, the market capitalization performance of listed companies was outstanding. Market capitalization growth has become an objective reflection of the strength of scientific and technological innovation and the achievements of industrial upgrading, promoting the allocation of resource elements to resonate with the country's medium- to long-term strategy.
Second, policy guidelines are more structured and precise. In recent years, the regulatory authorities have successively issued a series of policy documents. Systems such as mergers and acquisitions, cash dividends, and share repurchases have been continuously improved to optimize the “toolbox” for listed companies to carry out market value management work, guide listed companies to pay attention to their own investment value, and promote the collaborative improvement of the company's internal value and market valuation.
Third, listed companies are becoming more aware of taking the initiative. Some listed companies use market value management as a long-term strategic management act, formulate market value management systems and valuation improvement plans, formulate targeted measures at various levels such as company value increase, shareholder returns, and information disclosure, and promote the improvement of market expectations and strengthen long-term investment confidence through various methods such as normalized dividends, share repurchases, holdings growth, and optimized investor relationship management.
Fourth, institutional investment closely follows the main line of high-quality development. Institutional investors pay more attention to cutting-edge technology, advanced manufacturing, and future industries. Under the new “long money and long-term investment” ecosystem, more capital flows to hard technology, promotes the virtuous cycle of “strategic leadership - industrial innovation - market value increase - capital backfeed”, promotes high-quality development of new productivity, and helps the capital market to better perform its function of serving the real economy.
II. Overall analysis of the market capitalization performance of listed companies
At the overall market level, as of December 31, 2025, the Shanghai Composite Index increased 18.4% from 3351.76 points in early 2025 to 3968.84 points; at the end of 2025, there were 5,469 A-share listed companies with a total market value of 123 trillion yuan, of which 116 new listed companies were added in 2025, 5,353 stock companies listed before January 1, 2025, and the total market value of listed companies increased 22.5% year on year in 2025. The overall market valuation rose steadily in 2025, and the average net market ratio of A-share listed companies increased from 3.3 at the beginning of the year to 4.4. In addition, the share allocation of A-shares in public funds increased by 2.4 percentage points, reflecting investors' recognition of China's high-quality economic transformation and technological innovation development.
At the industry level, the market value of technology-driven industries increased significantly in 2025. The market value of high-tech enterprises represented by manufacturing, scientific research and technical services changed the most. The total market capitalization increased by 33.3% and 32.1%, respectively, from the beginning of the year, and their share in A-share market value increased by 4.2 percentage points and 0.1 percentage points respectively. On the one hand, the overall performance of technology companies supports the valuation. In 2025, nearly half of listed companies in the manufacturing and scientific research and technical services industries had a return on net assets (ROE) greater than 5%. On the other hand, market capital pays more attention to technology-based enterprises, and capital inflows provide a solid foundation for increasing market value. Take public funds as an example. In the third quarter of 2025, capital flows to the two industries of information transmission, software and information technology services, and scientific research and technical services increased 0.6 percentage points compared to the beginning of the year.
At the level of enterprises with different forms of ownership, private science and technology innovation listed companies performed well in 2025. The overall market value of private listed companies increased by 37.0%, and their share in the A-share market value increased from 33.6% at the beginning of the year to 37.5%. State-owned listed companies account for nearly 50% of the A-share market value.
III. Dimensional analysis of the market capitalization performance of listed companies
The following is an objective summary and analysis of the market capitalization performance data of listed companies in 2025 from the three dimensions of absolute market capitalization growth, market capitalization growth rate, and industry market capitalization growth of listed companies. The statistical sample of listed companies is an A-share listed company that was listed on the Shanghai and Shenzhen-North Stock Exchange before January 1, 2025 and has not been delisted as of December 31, 2025 (ST and*ST companies are not included).
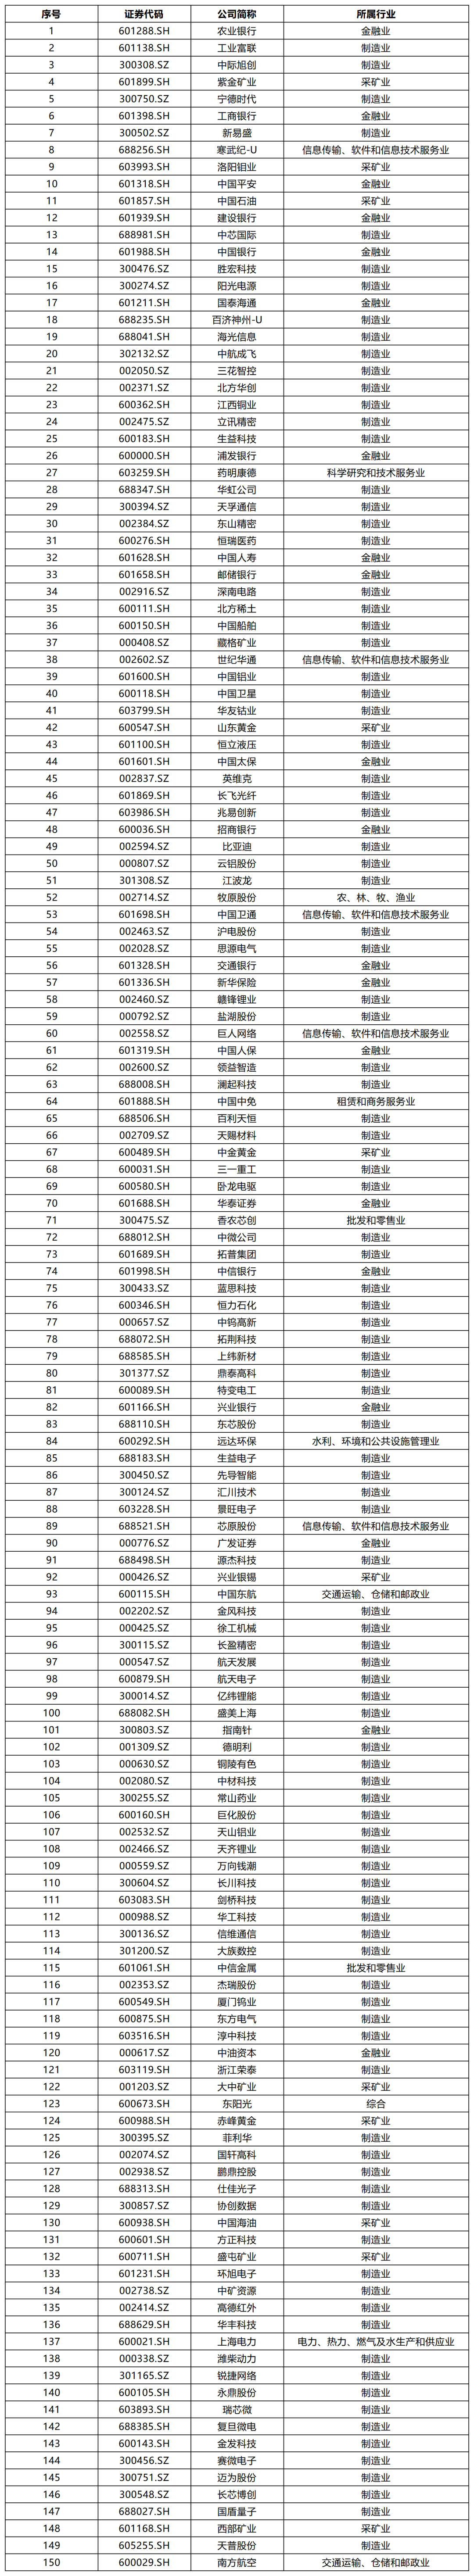
(1) Analysis of absolute market capitalization growth
Sort through the market value change data of A-share listed companies from January 1, 2025 to December 31, 2025, and count the 150 listed companies with the most prominent increase in the absolute value of A-share market value of listed companies. For details, see Table 1 below.
Table 1. The 150 listed companies with the most prominent increase in A-share market value of listed companies in 2025
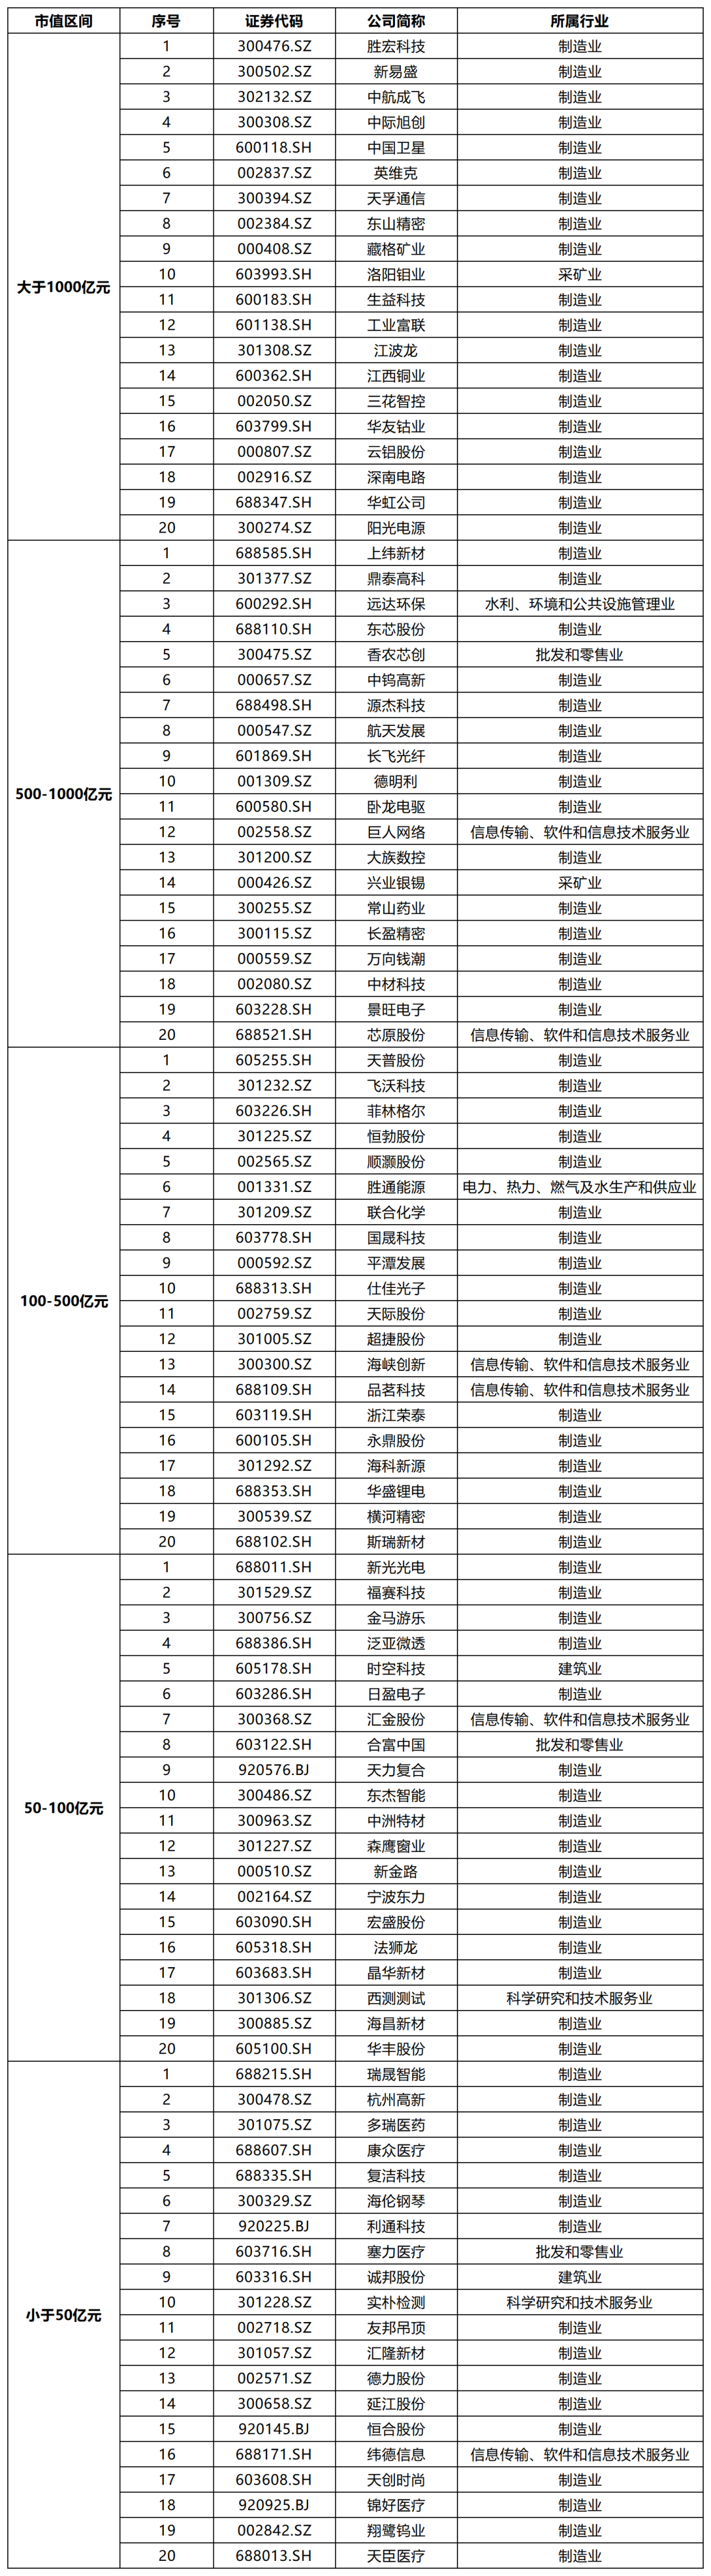
(2) Analysis of market capitalization growth rate
Based on the market value of listed companies on December 31, 2025, it is divided into 5 market capitalization ranges of less than 5 billion, 5-10 billion, 100-50 billion, 50 to 100 billion yuan, and greater than 100 billion yuan. The 20 A-share listed companies with the highest market capitalization growth rate in 2025 are counted separately in each market capitalization range. For details of changes in the market value of companies in each region, see Table 2 below.
Table 2. The 100 listed companies with the most prominent changes in the market value growth rate of A-shares in each range in 2025
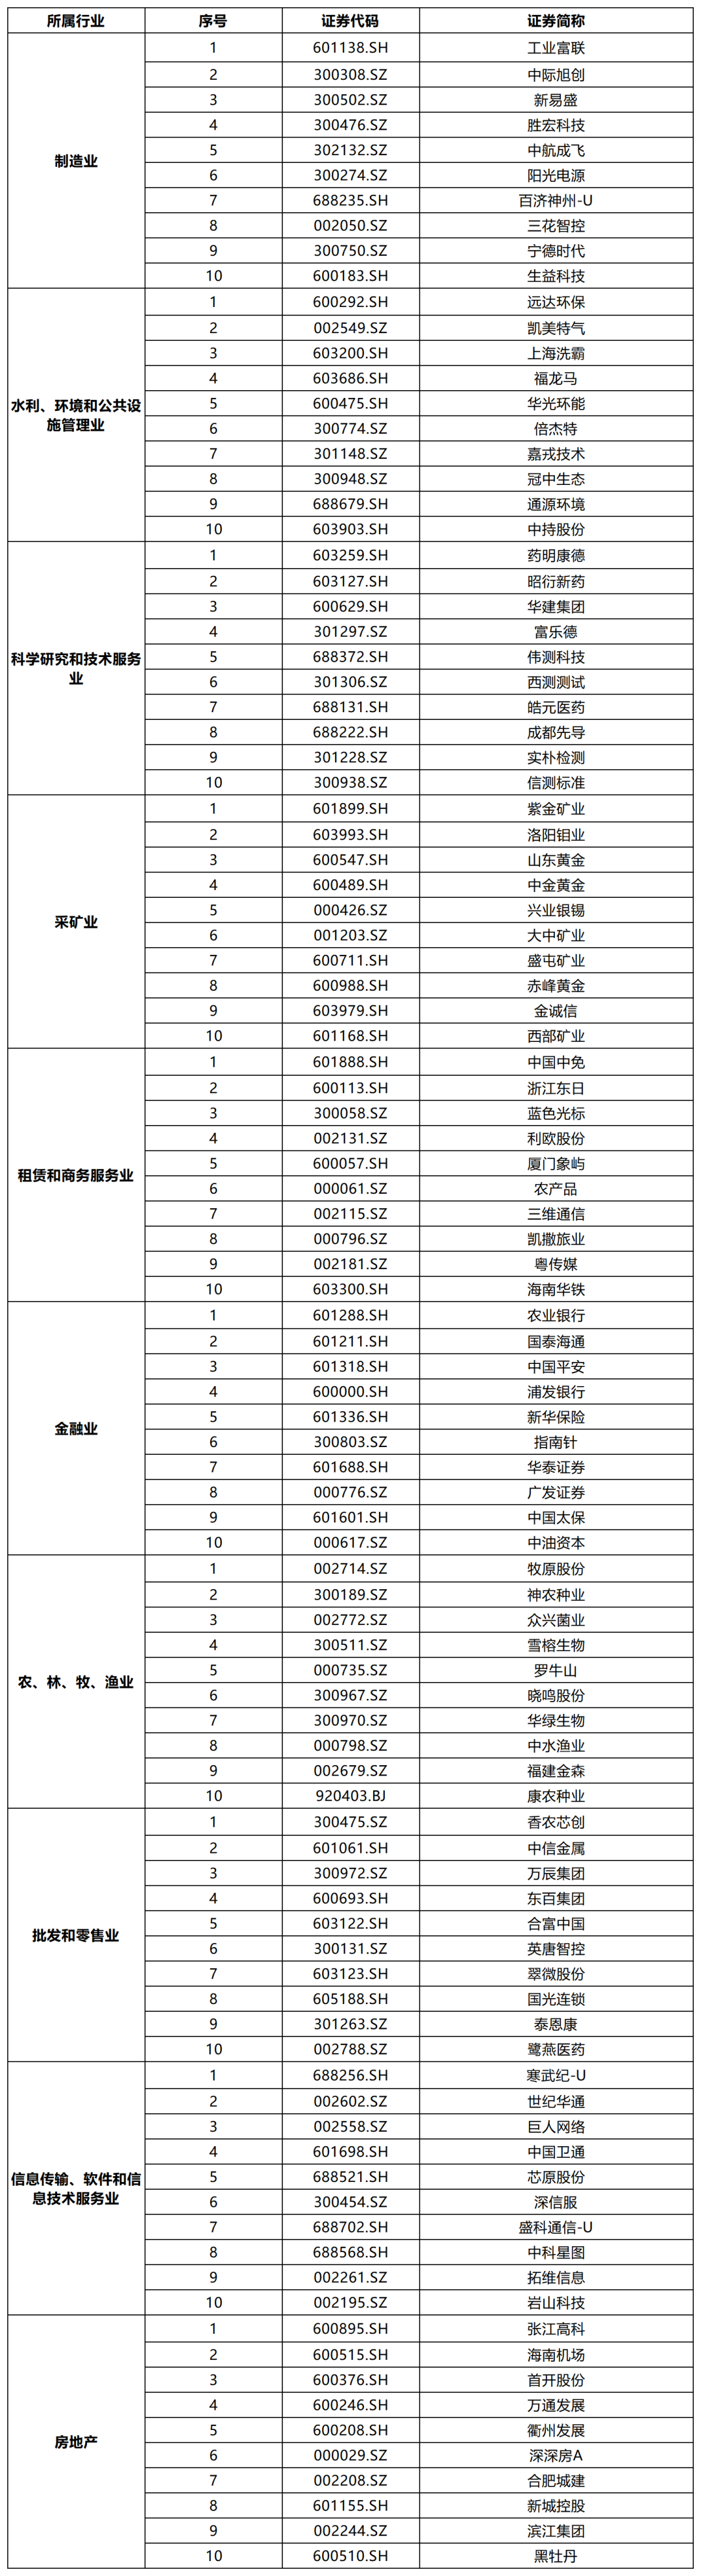
(3) Comparative analysis of market capitalization growth of listed companies in various industries
Based on the CSSC industry classification, the 10 industries with the highest total market capitalization growth rate in 2025 are selected, and the 10 companies with the fastest market capitalization growth rate (market capitalization as a share of the total market value of the industry in which they are located) are counted. To ensure the validity and representation of the statistical results, the study excluded industry samples with less than 30 constituent stocks. For details of changes in market value of companies in various industries, see Table 3 below.
Table 3 The 100 listed companies with the most prominent market share changes in the top 10 industries that grew in 2025