
European Market Insights: Gentili Mosconi And 2 Other Promising Penny Stocks
As the European markets continue to thrive, with the STOXX Europe 600 Index reaching new heights and major indices like Germany's DAX and France's CAC 40 posting gains, investors are increasingly looking for opportunities beyond traditional blue-chip stocks. Penny stocks, though often associated with earlier market eras, still represent a viable investment area by highlighting smaller or less-established companies that may offer significant value. By focusing on those with robust financials and potential growth trajectories, investors can uncover promising opportunities within this segment of the market.
Top 10 Penny Stocks In Europe
| Name | Share Price | Market Cap | Rewards & Risks |
| Ariston Holding (BIT:ARIS) | €4.484 | €1.55B | ✅ 4 ⚠️ 3 View Analysis > |
| Orthex Oyj (HLSE:ORTHEX) | €4.73 | €84M | ✅ 4 ⚠️ 1 View Analysis > |
| Lucisano Media Group (BIT:LMG) | €1.04 | €15.45M | ✅ 4 ⚠️ 5 View Analysis > |
| Angler Gaming (NGM:ANGL) | SEK3.60 | SEK269.95M | ✅ 4 ⚠️ 2 View Analysis > |
| Angler Gaming (DB:0QM) | €0.31 | €226.45M | ✅ 3 ⚠️ 3 View Analysis > |
| Libertas 7 (BME:LIB) | €3.16 | €67.03M | ✅ 3 ⚠️ 3 View Analysis > |
| Hultstrom Group (OM:HULT B) | SEK3.20 | SEK194.68M | ✅ 2 ⚠️ 2 View Analysis > |
| ForFarmers (ENXTAM:FFARM) | €4.485 | €396.41M | ✅ 4 ⚠️ 1 View Analysis > |
| Deceuninck (ENXTBR:DECB) | €2.265 | €313.07M | ✅ 4 ⚠️ 1 View Analysis > |
| Dovre Group (HLSE:DOV1V) | €0.0726 | €7.89M | ✅ 2 ⚠️ 3 View Analysis > |
Click here to see the full list of 286 stocks from our European Penny Stocks screener.
Here's a peek at a few of the choices from the screener.
Gentili Mosconi (BIT:GM)
Simply Wall St Financial Health Rating: ★★★★☆☆
Overview: Gentili Mosconi S.p.A. and its subsidiaries manufacture and sell printed and dyed fabrics in Italy, the rest of the European Union, and internationally, with a market cap of €69.80 million.
Operations: The company's revenue is primarily derived from Fabrics (€20.09 million), Fashion Textile Accessories (€17.40 million), and Printing and Dyeing Processes of Fabrics (€3.23 million), with additional contributions from Home Textile Accessories (€0.98 million).
Market Cap: €69.8M
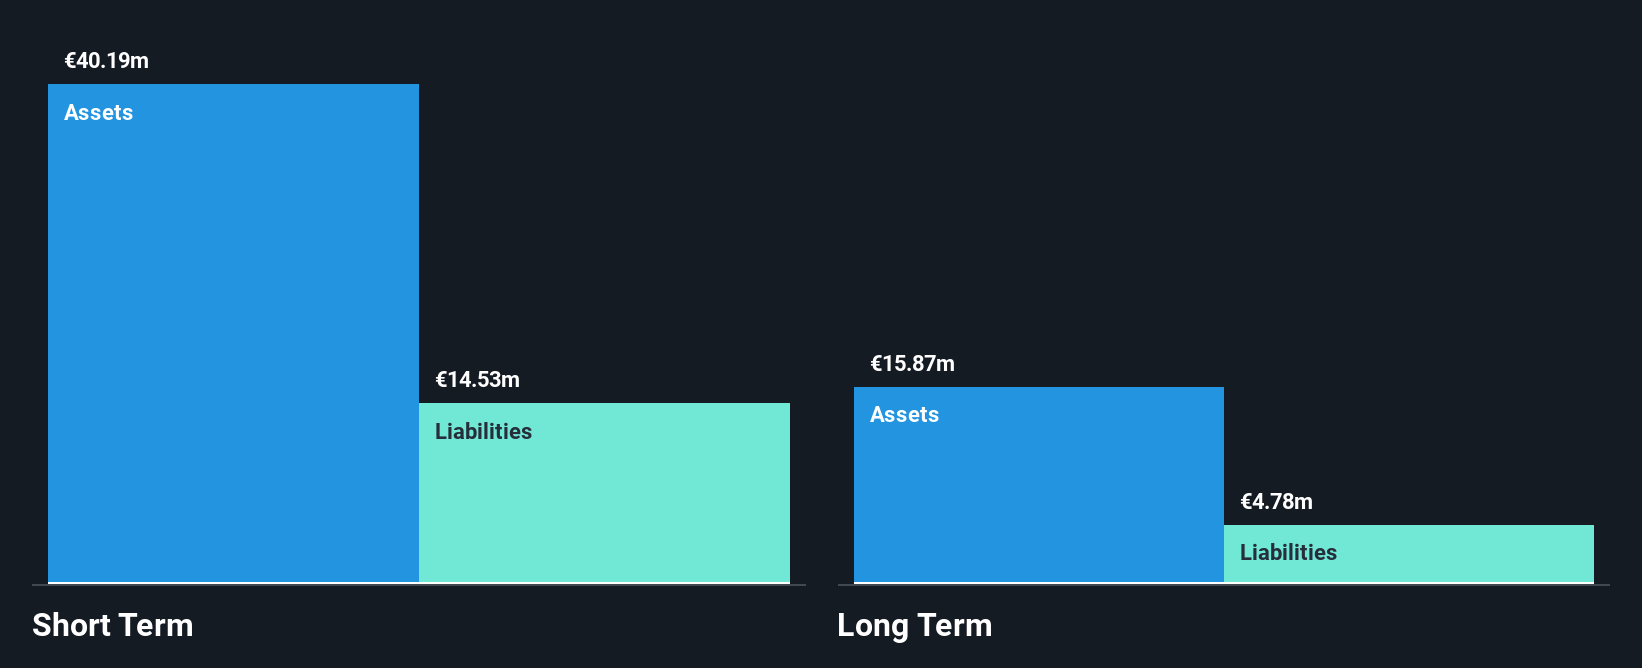
Gentili Mosconi S.p.A., with a market cap of €69.80 million, derives revenue primarily from fabrics and accessories, totaling €41.70 million. Although unprofitable, the company has more cash than debt and its short-term assets exceed both short- and long-term liabilities, indicating financial stability despite losses increasing at 18.8% per year over five years. Trading at 46.7% below estimated fair value suggests potential undervaluation; however, dividend sustainability is questionable due to insufficient earnings coverage. Earnings are forecast to grow significantly by 80.31% annually, but past profitability issues remain a concern for investors in penny stocks.
- Jump into the full analysis health report here for a deeper understanding of Gentili Mosconi.
- Examine Gentili Mosconi's earnings growth report to understand how analysts expect it to perform.
Tecnotree Oyj (HLSE:TEM1V)
Simply Wall St Financial Health Rating: ★★★★★★
Overview: Tecnotree Oyj offers telecommunication IT solutions including charging, billing, customer care, and messaging and content services across Europe, the Americas, the Middle East, Africa, and the Asia Pacific with a market cap of €67.75 million.
Operations: The company's revenue is primarily derived from two segments: €18.73 million from Europe and the Americas, and €51.63 million from the Middle East, Africa, and Asia Pacific regions.
Market Cap: €67.75M
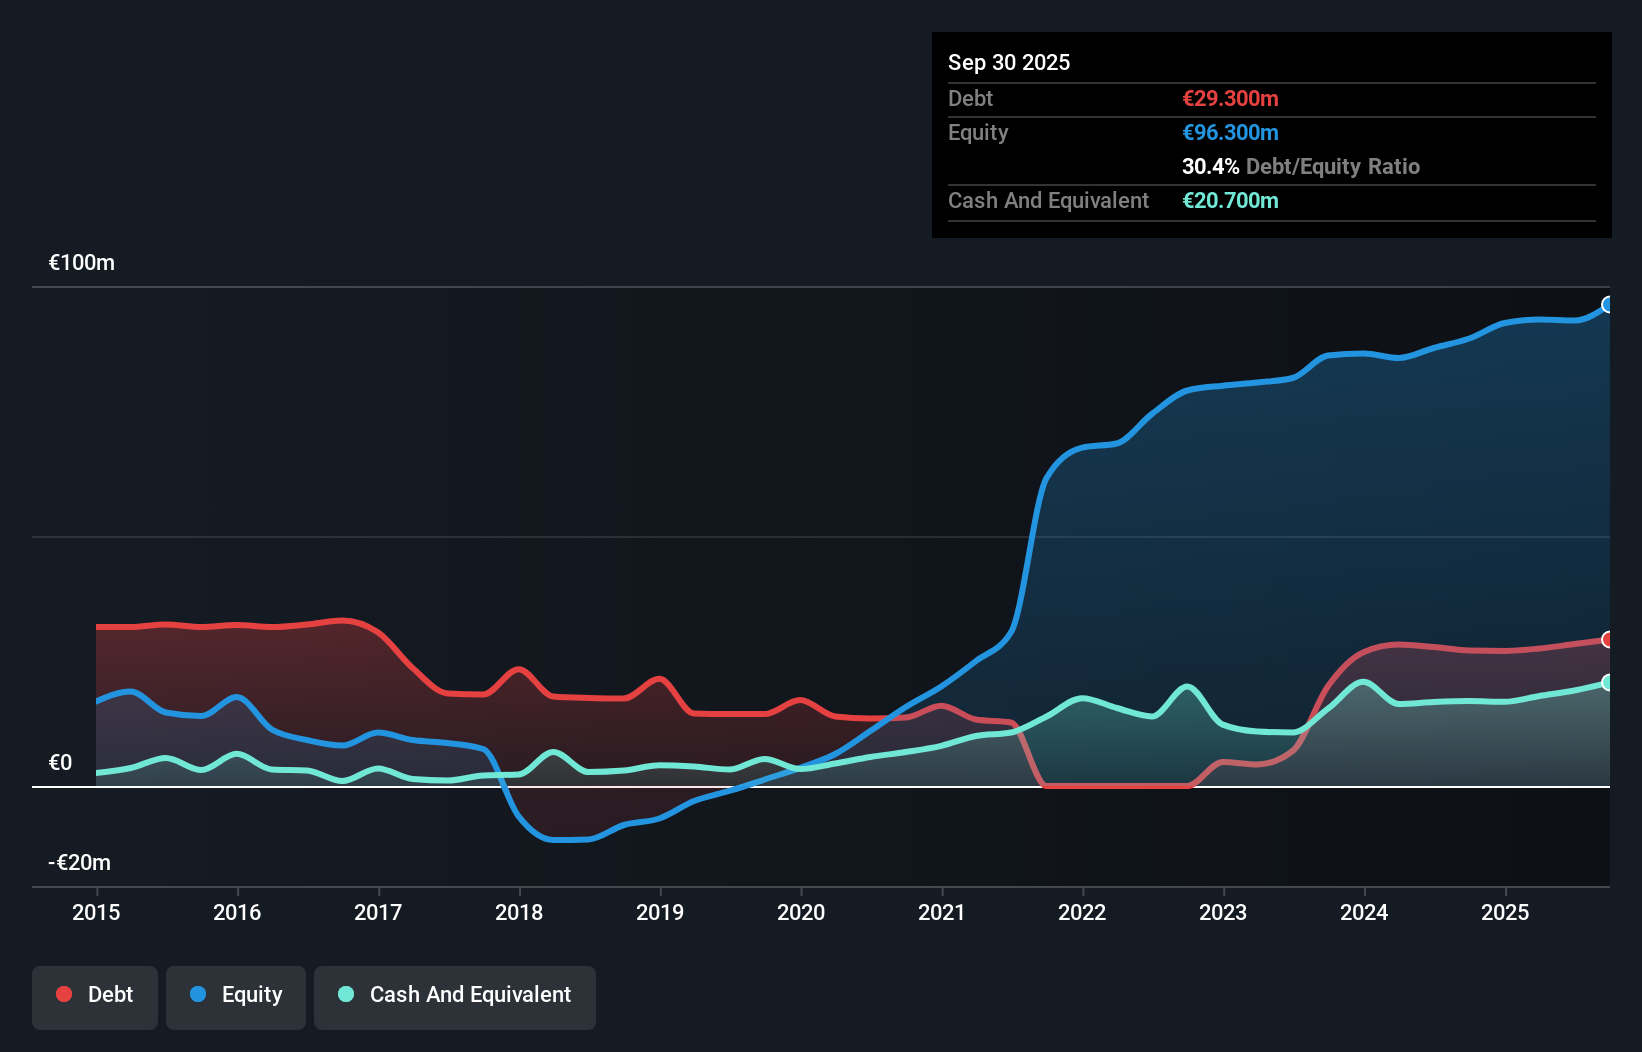
Tecnotree Oyj, with a market cap of €67.75 million, shows financial resilience as its short-term assets exceed both short- and long-term liabilities. Despite trading at 56% below estimated fair value, the company faces challenges with declining earnings over five years and recent negative growth. The company's debt is well-managed, with a net debt to equity ratio of 8.9% and interest payments covered by EBIT 36.8 times over. Recent earnings reports show stable net income but slight declines in sales and basic earnings per share compared to previous periods, while dividend policy targets 10% of free cash flow amid modest sales growth guidance for 2025.
- Unlock comprehensive insights into our analysis of Tecnotree Oyj stock in this financial health report.
- Gain insights into Tecnotree Oyj's outlook and expected performance with our report on the company's earnings estimates.
Pricer (OM:PRIC B)
Simply Wall St Financial Health Rating: ★★★★☆☆
Overview: Pricer AB (publ) offers in-store digital solutions across Europe, the Middle East and Africa, the Americas, and Asia and Pacific with a market cap of SEK723.73 million.
Operations: Pricer's revenue primarily comes from its Electronic Components & Parts segment, totaling SEK2.21 billion.
Market Cap: SEK723.73M
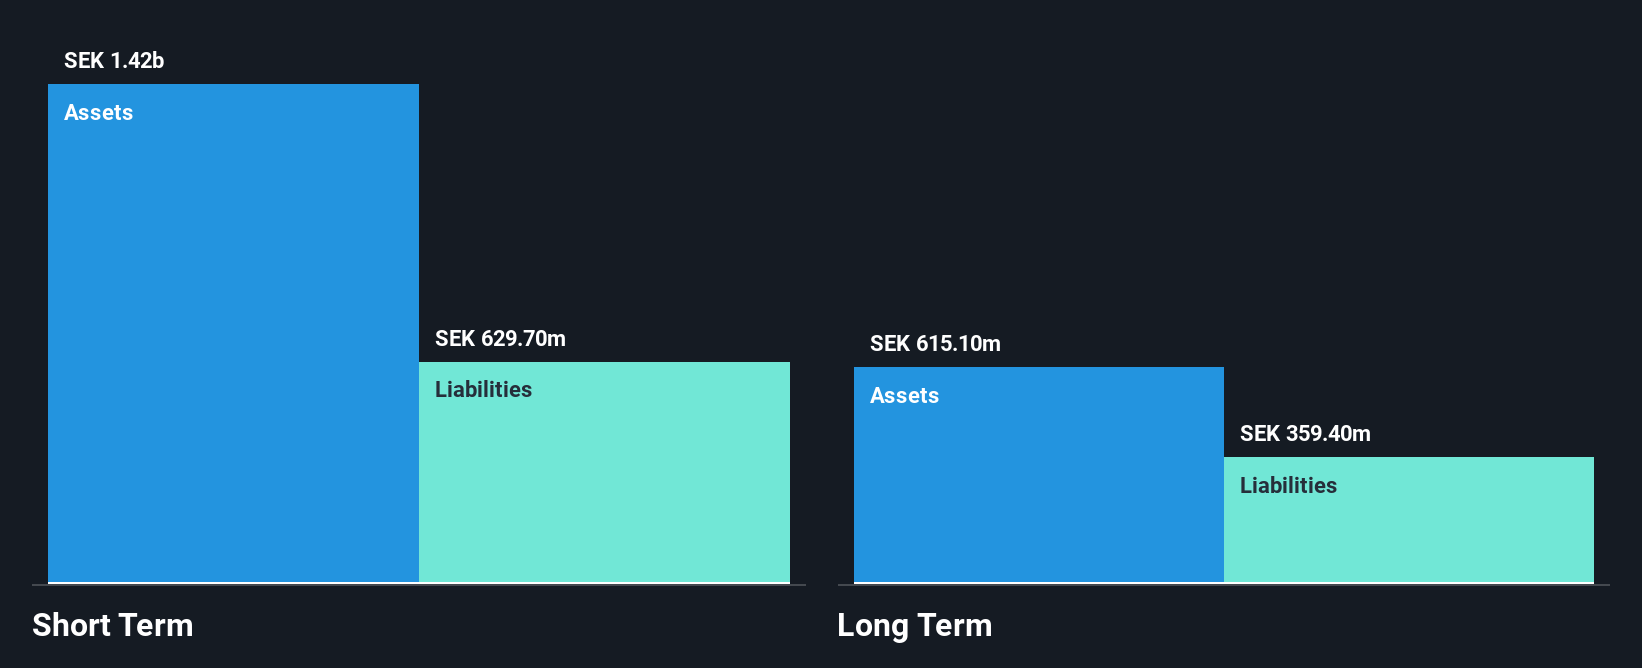
Pricer AB, with a market cap of SEK723.73 million, is navigating the penny stock landscape amid mixed financial signals. The company has secured significant agreements, such as a SEK140 million order from PLUS and an exclusive framework with Merchants Distributors in the US, enhancing its presence in retail digitalization. Despite satisfactory debt management and strong short-term asset coverage over liabilities, Pricer faces challenges with declining earnings growth and shrinking profit margins. Recent earnings reports indicate reduced sales and net income compared to previous periods, though future earnings are forecasted to grow substantially at 75.84% per year.
- Click here to discover the nuances of Pricer with our detailed analytical financial health report.
- Explore Pricer's analyst forecasts in our growth report.
Key Takeaways
- Click here to access our complete index of 286 European Penny Stocks.
- Searching for a Fresh Perspective? The end of cancer? These 29 emerging AI stocks are developing tech that will allow early idenification of life changing disesaes like cancer and Alzheimer's.
This article by Simply Wall St is general in nature. We provide commentary based on historical data and analyst forecasts only using an unbiased methodology and our articles are not intended to be financial advice. It does not constitute a recommendation to buy or sell any stock, and does not take account of your objectives, or your financial situation. We aim to bring you long-term focused analysis driven by fundamental data. Note that our analysis may not factor in the latest price-sensitive company announcements or qualitative material. Simply Wall St has no position in any stocks mentioned.
Have feedback on this article? Concerned about the content? Get in touch with us directly. Alternatively, email editorial-team@simplywallst.com