
Is Occidental Petroleum (OXY) Pricing Reflecting Its Large DCF Upside?
- If you are wondering whether Occidental Petroleum's current share price gives you fair value, or if there is a margin of safety on the table, this article is designed to walk you through the numbers clearly.
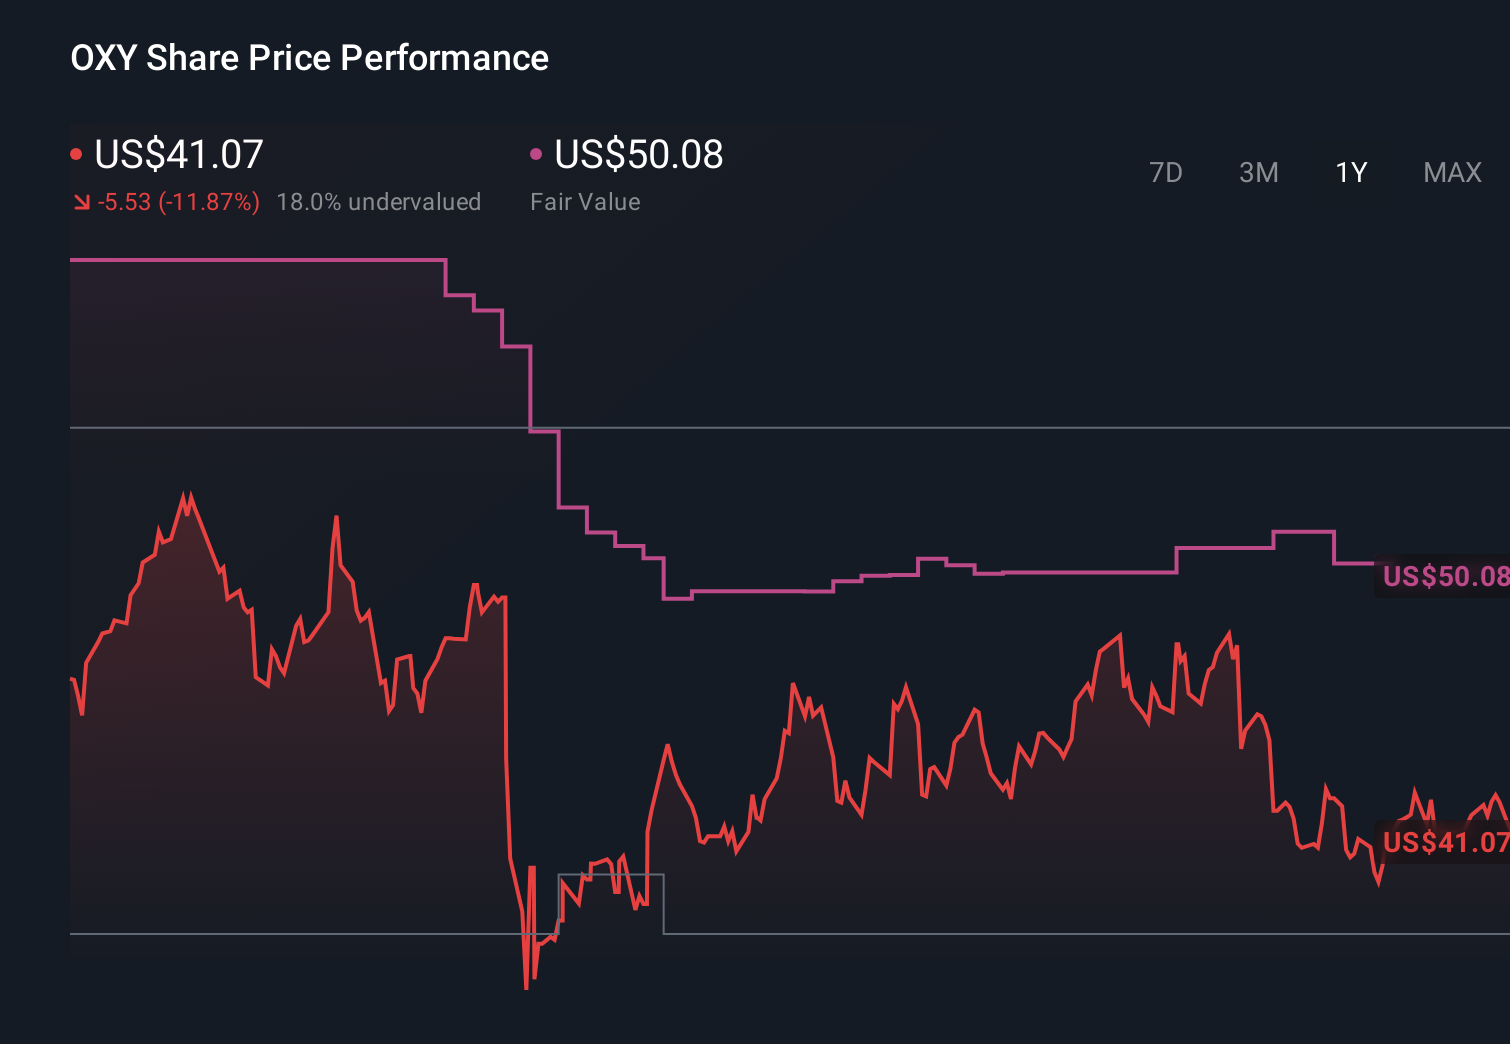
- The stock last closed at US$42.38, with a 4.9% return over the past 7 days, flat performance over 30 days at 0.1% decline, and longer term returns of 14.7% decline over 1 year, 30.5% decline over 3 years, and 124.0% gain over 5 years.
- Recent coverage around Occidental Petroleum has focused on its position as a large US oil and gas producer and on ongoing investor interest in energy companies as part of sector allocation decisions. These themes provide important context for the share price moves and help frame how investors might think about what they are paying for exposure to the business.
- Our Simply Wall St valuation checks give Occidental Petroleum a value score of 2 out of 6, meaning it screens as undervalued on 2 of the 6 measures we apply. Next, we will look at what different valuation approaches say about that pricing, before finishing with a broader way of thinking about value that can tie those methods together.
Occidental Petroleum scores just 2/6 on our valuation checks. See what other red flags we found in the full valuation breakdown.
Approach 1: Occidental Petroleum Discounted Cash Flow (DCF) Analysis
A Discounted Cash Flow (DCF) model estimates what a business could be worth by projecting the cash it may generate in the future, then discounting those cash flows back into today’s dollars.
For Occidental Petroleum, the model used is a 2 Stage Free Cash Flow to Equity approach. The latest twelve month free cash flow is about $4.40b. Simply Wall St then projects future free cash flows, using analyst estimates where available and extrapolating further out. For example, projected free cash flow for 2027 is $4.54b, and by 2035 the model uses an extrapolated free cash flow of about $5.30b.
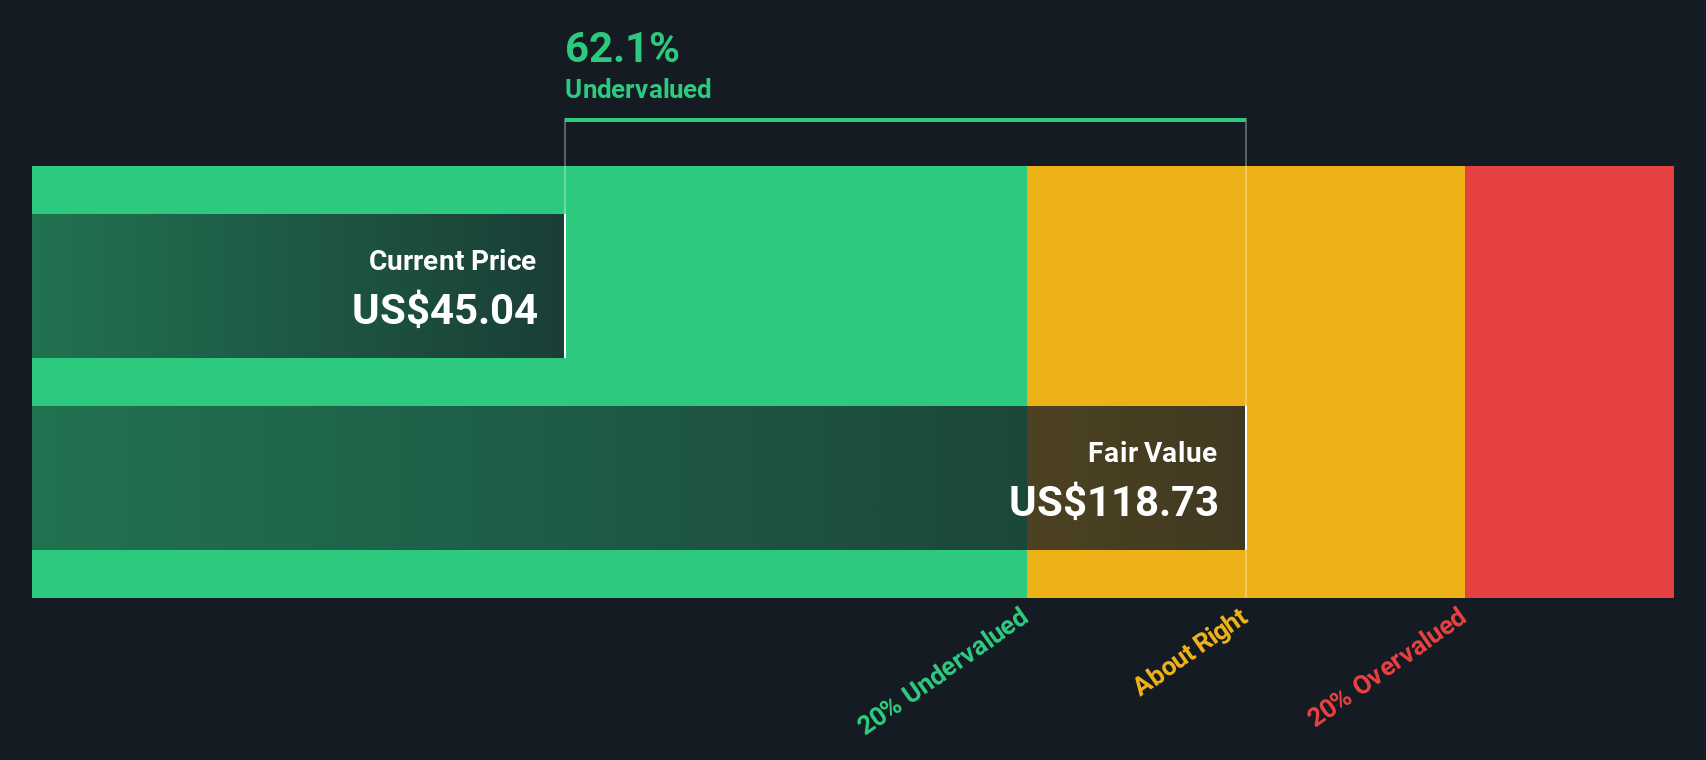
When all these projected cash flows are discounted back and combined, the DCF model suggests an intrinsic value of about $105.31 per share. Compared with the recent share price of US$42.38, this implies an intrinsic discount of roughly 59.8%, which indicates that the stock screens as undervalued on this method.
Result: UNDERVALUED
Our Discounted Cash Flow (DCF) analysis suggests Occidental Petroleum is undervalued by 59.8%. Track this in your watchlist or portfolio, or discover 870 more undervalued stocks based on cash flows.
Approach 2: Occidental Petroleum Price vs Earnings
For a profitable company like Occidental Petroleum, the P/E ratio is a useful shorthand for what you are paying today for each dollar of current earnings. Investors usually accept a higher or lower P/E based on what they expect for future earnings growth and how risky those earnings appear to be.
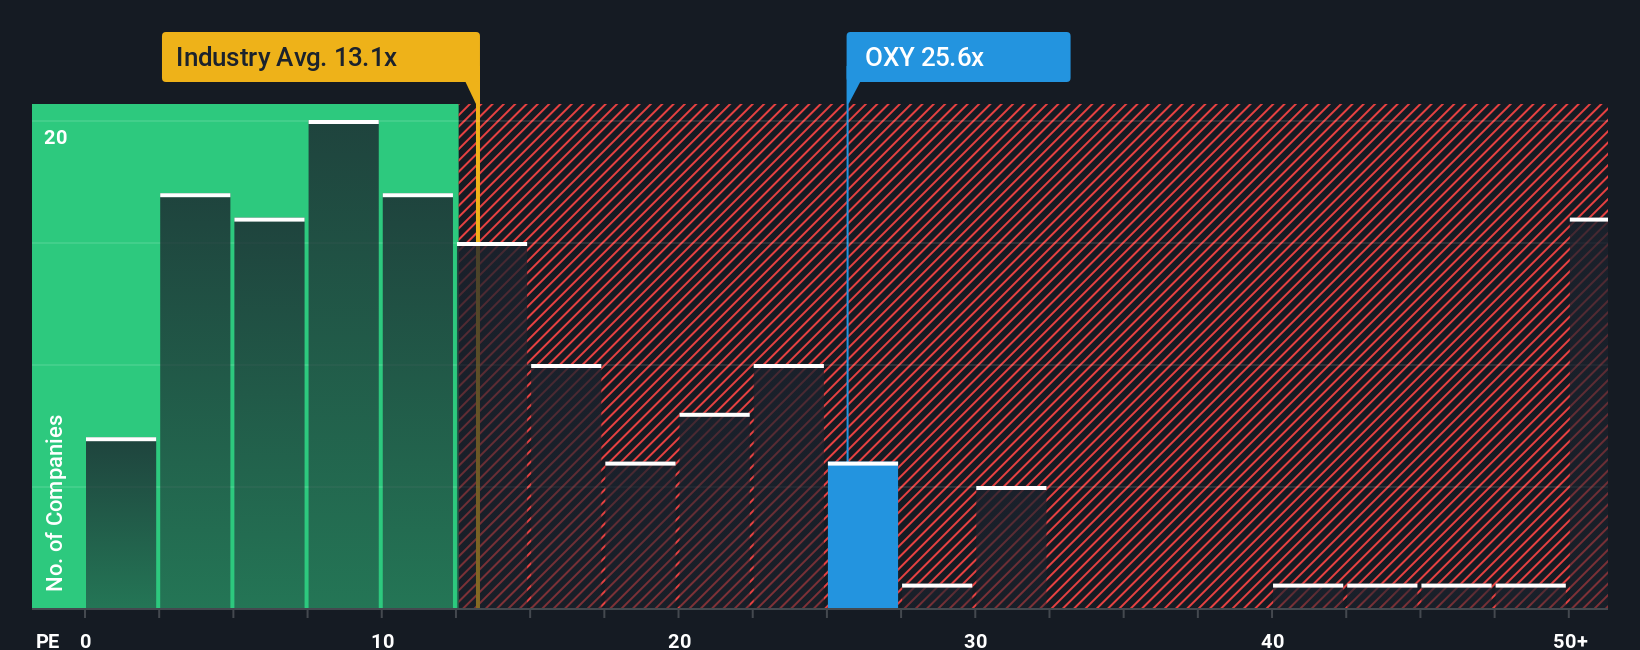
Occidental Petroleum currently trades on a P/E of 28.6x. That compares with an Oil and Gas industry average P/E of 13.2x and a peer group average of 21.0x, so the shares trade at a higher multiple than both of those simple benchmarks.
Simply Wall St also calculates a “Fair Ratio” for the stock, which is the P/E you might expect given factors such as its earnings growth profile, industry, profit margins, market cap and key risks. For Occidental Petroleum, this Fair Ratio is 16.6x. This stock specific view can be more informative than a straight comparison with peers or the broad industry, because it adjusts for differences in business quality and risk. Since the current P/E of 28.6x is meaningfully above the Fair Ratio of 16.6x, the shares screen as expensive on this measure.
Result: OVERVALUED
P/E ratios tell one story, but what if the real opportunity lies elsewhere? Discover 1462 companies where insiders are betting big on explosive growth.
Upgrade Your Decision Making: Choose your Occidental Petroleum Narrative
Earlier we mentioned that there is an even better way to understand valuation, so let us introduce you to Narratives. These are simple stories investors create on Simply Wall St’s Community page that link their view of Occidental Petroleum’s business to a set of revenue, earnings and margin forecasts, and then to a fair value that they can compare with today’s price to help decide whether to buy, hold, or sell. Each Narrative updates automatically when fresh news or earnings arrive. For example, one Occidental Narrative is currently using a fair value of about US$55.05 per share and another is using about US$49.92 per share. This shows how two investors can look at the same company, factor in things like oil exposure, carbon capture projects and balance sheet goals differently, and still use the same easy tool to keep their story and numbers joined together over time.
Do you think there's more to the story for Occidental Petroleum? Head over to our Community to see what others are saying!
This article by Simply Wall St is general in nature. We provide commentary based on historical data and analyst forecasts only using an unbiased methodology and our articles are not intended to be financial advice. It does not constitute a recommendation to buy or sell any stock, and does not take account of your objectives, or your financial situation. We aim to bring you long-term focused analysis driven by fundamental data. Note that our analysis may not factor in the latest price-sensitive company announcements or qualitative material. Simply Wall St has no position in any stocks mentioned.
Have feedback on this article? Concerned about the content? Get in touch with us directly. Alternatively, email editorial-team@simplywallst.com