
Is It Time To Reassess Veeva Systems (VEEV) After Recent Share Price Weakness
- Wondering if Veeva Systems at around US$219.49 is offering fair value right now, or if the current price is out of line with its fundamentals.
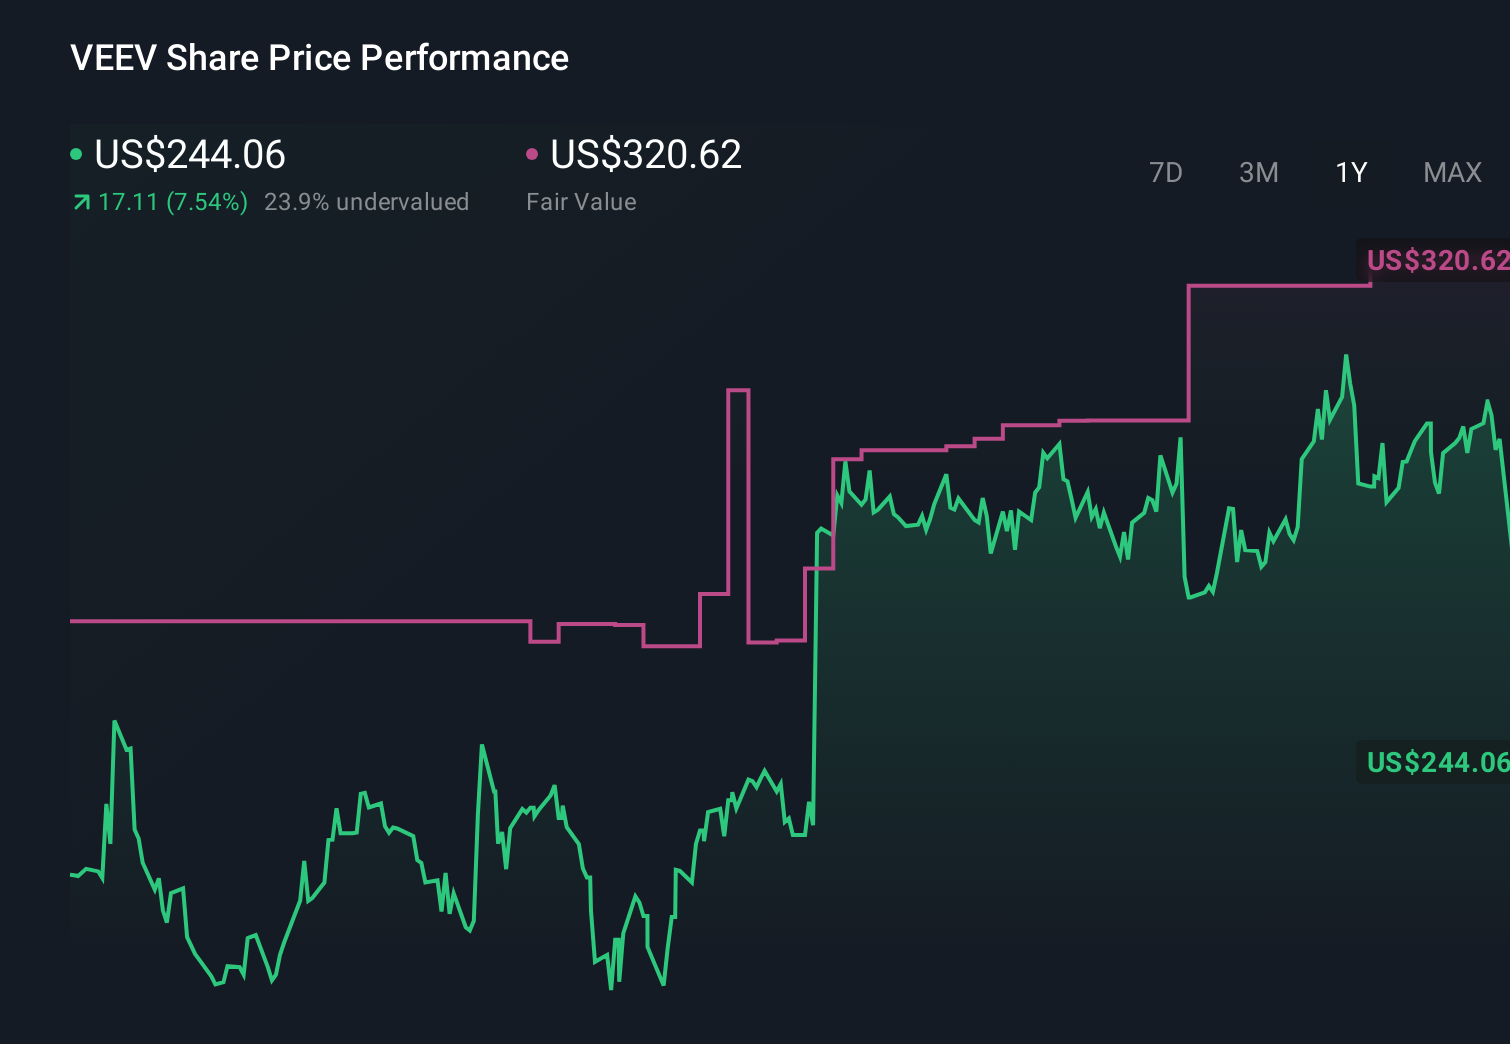
- The stock's recent returns are mixed, with a 7 day return of a 2.5% decline, a 30 day return of a 9.3% decline, and a 1 year return of 3.1%, on top of a 36.3% return over 3 years and a 23.8% decline over 5 years.
- Recent attention on Veeva Systems has centered on its role as a healthcare and life sciences software provider, with investors weighing how its position in that niche supports long term business prospects. At the same time, the share price path you see in the returns data has kept valuation firmly in focus for many shareholders.
- On Simply Wall St's 6 point valuation framework, Veeva Systems has a valuation score of 4, which suggests it screens as undervalued on several checks. Next we will compare different valuation approaches before coming back to a broader way of thinking about value at the end of the article.
Approach 1: Veeva Systems Discounted Cash Flow (DCF) Analysis
A Discounted Cash Flow, or DCF, model estimates what a company could be worth today by projecting its future cash flows and then discounting those back to a present value.
For Veeva Systems, the model used is a 2 Stage Free Cash Flow to Equity approach. The latest twelve month free cash flow is about $1.35b. Analysts and extrapolated estimates point to free cash flow of about $2.38b in 2030, with a full set of projections from 2026 through 2035 that Simply Wall St discounts back to today using its own assumptions.
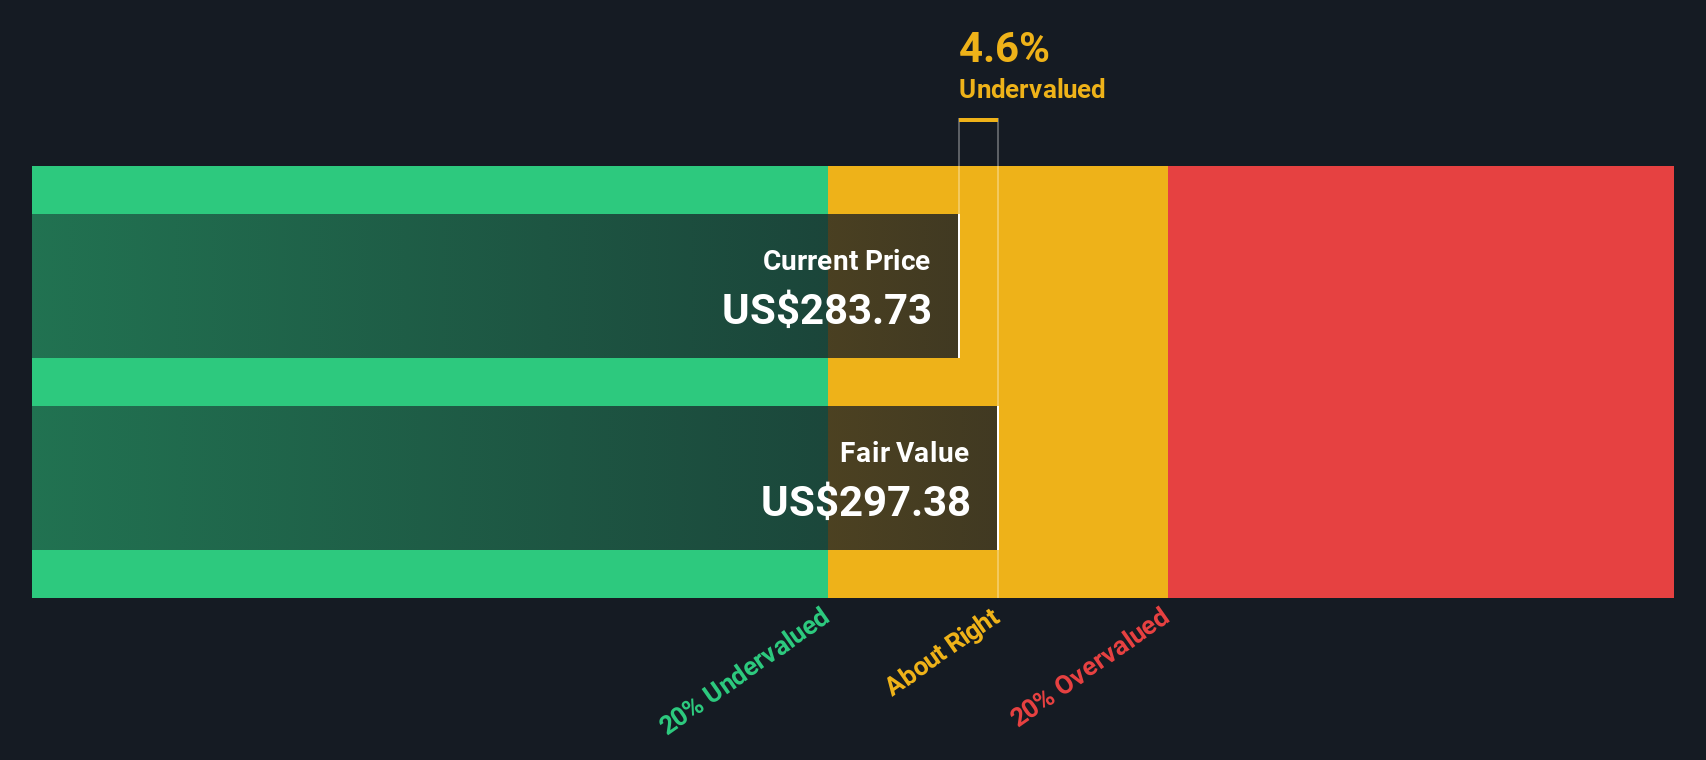
Putting all those projected cash flows together, the DCF model arrives at an estimated intrinsic value of about $289.09 per share. Compared with the recent share price of around $219.49, this suggests the stock appears about 24.1% undervalued according to this method.
Result: UNDERVALUED
Our Discounted Cash Flow (DCF) analysis suggests Veeva Systems is undervalued by 24.1%. Track this in your watchlist or portfolio, or discover 870 more undervalued stocks based on cash flows.
Approach 2: Veeva Systems Price vs Earnings
For profitable companies, the P/E ratio is a useful way to think about value, because it links what you pay for each share to the earnings that the business is currently generating. The higher the expected growth and the lower the perceived risk, the more investors are usually willing to pay in the form of a higher P/E.
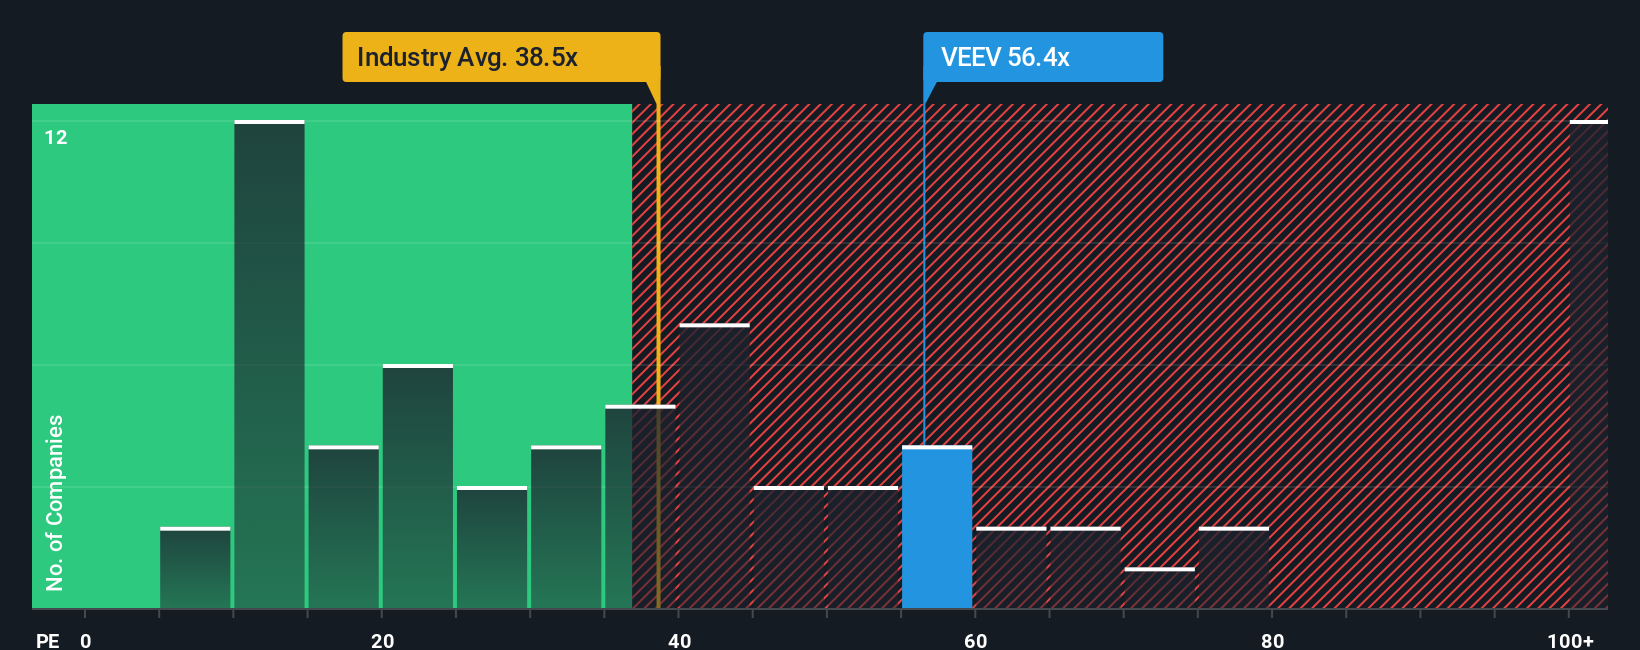
Veeva Systems is trading on a P/E of 41.94x, compared with the Healthcare Services industry average of 32.44x and a peer group average of 60.89x. Simply Wall St also calculates a proprietary “Fair Ratio” of 32.11x for Veeva’s P/E. This Fair Ratio is designed to reflect what might be reasonable for the company given factors such as its earnings growth profile, profit margins, size, risk characteristics and its industry.
Because the Fair Ratio is tailored to Veeva Systems, it can be more informative than a simple comparison with peers or the broad industry, which may have very different growth, risk and profitability. With the current P/E of 41.94x sitting above the Fair Ratio of 32.11x, this approach points to the shares screening as overvalued on earnings.
Result: OVERVALUED
P/E ratios tell one story, but what if the real opportunity lies elsewhere? Discover 1462 companies where insiders are betting big on explosive growth.
Upgrade Your Decision Making: Choose your Veeva Systems Narrative
Earlier we mentioned that there is an even better way to understand valuation. Let us introduce Narratives, which are simple stories you build around your view of Veeva Systems. They connect your assumptions for future revenue, earnings, margins and fair value to the current price. Narratives live inside Simply Wall St's Community page, update automatically as new news or earnings arrive, and can differ widely. For example, one Veeva Narrative on the platform currently points to a fair value of about US$362 per share, while another sits closer to US$222, giving you a clear, side by side sense of how different forecasts and risk views translate into very different ideas about whether the stock looks expensive or cheap to you.
Do you think there's more to the story for Veeva Systems? Head over to our Community to see what others are saying!
This article by Simply Wall St is general in nature. We provide commentary based on historical data and analyst forecasts only using an unbiased methodology and our articles are not intended to be financial advice. It does not constitute a recommendation to buy or sell any stock, and does not take account of your objectives, or your financial situation. We aim to bring you long-term focused analysis driven by fundamental data. Note that our analysis may not factor in the latest price-sensitive company announcements or qualitative material. Simply Wall St has no position in any stocks mentioned.
Have feedback on this article? Concerned about the content? Get in touch with us directly. Alternatively, email editorial-team@simplywallst.com