
Assessing Denali Therapeutics (DNLI) Valuation After Positive Hunter Syndrome Trial Data And FDA Priority Review
Denali Therapeutics (DNLI) is back in focus after publishing detailed Phase 1/2 data for its investigational Hunter Syndrome therapy, tividenofusp alfa. This therapy also underpins an ongoing FDA Priority Review for potential accelerated approval.
See our latest analysis for Denali Therapeutics.
Despite the latest clinical update and the ongoing FDA Priority Review, Denali Therapeutics’ recent 30 day share price return of an 18.49% decline contrasts with a 9.19% gain over 90 days. However, the 1 year total shareholder return of a 17.91% decline and 5 year total shareholder return of a 78.77% decline show that long term holders have faced sustained pressure, so recent momentum looks fragile rather than firmly established.
If this kind of biotech catalyst has caught your attention, it could be a good moment to see what else is setting up in healthcare stocks.
With the stock trading at US$16.27 and an indicated intrinsic discount of roughly 49%, yet a 5-year total shareholder return showing a 78.77% decline, is this setting up a buying opportunity, or is the market already pricing in future growth?
Price to Book of 2.7x: Is it justified?
At a last close of US$16.27, Denali Therapeutics is described as good value on a 2.7x P/B compared with peers at 13x, yet in line with the broader US biotechs industry average of 2.7x.
The P/B ratio compares the company’s market value to its net assets on the balance sheet. It is often used for pre profit or early revenue biopharma names where traditional earnings based metrics are not yet meaningful. For Denali Therapeutics, this means investors are currently paying 2.7 times the company’s book value per share.
According to the assessment provided, DNLI is viewed as good value when lined up against a selected peer group P/B of 13x, which implies the market is attaching a lower balance sheet multiple than it does to those peers at present. At the same time, the stock is described as expensive relative to the wider US biotechs industry P/B average of 2.7x, which suggests that on this particular metric the market is not applying a clear discount versus the sector as a whole.
Given that the fair P/B ratio could not be calculated, there is no regression based level that the market might converge toward as more information on the business develops over time.
See what the numbers say about this price — find out in our valuation breakdown.
Result: Price to Book of 2.7x (ABOUT RIGHT)
However, the story can change quickly if the Priority Review outcome disappoints or if Denali’s broader pipeline, which is still loss making, experiences clinical setbacks.
Find out about the key risks to this Denali Therapeutics narrative.
Another View: What Does The DCF Say?
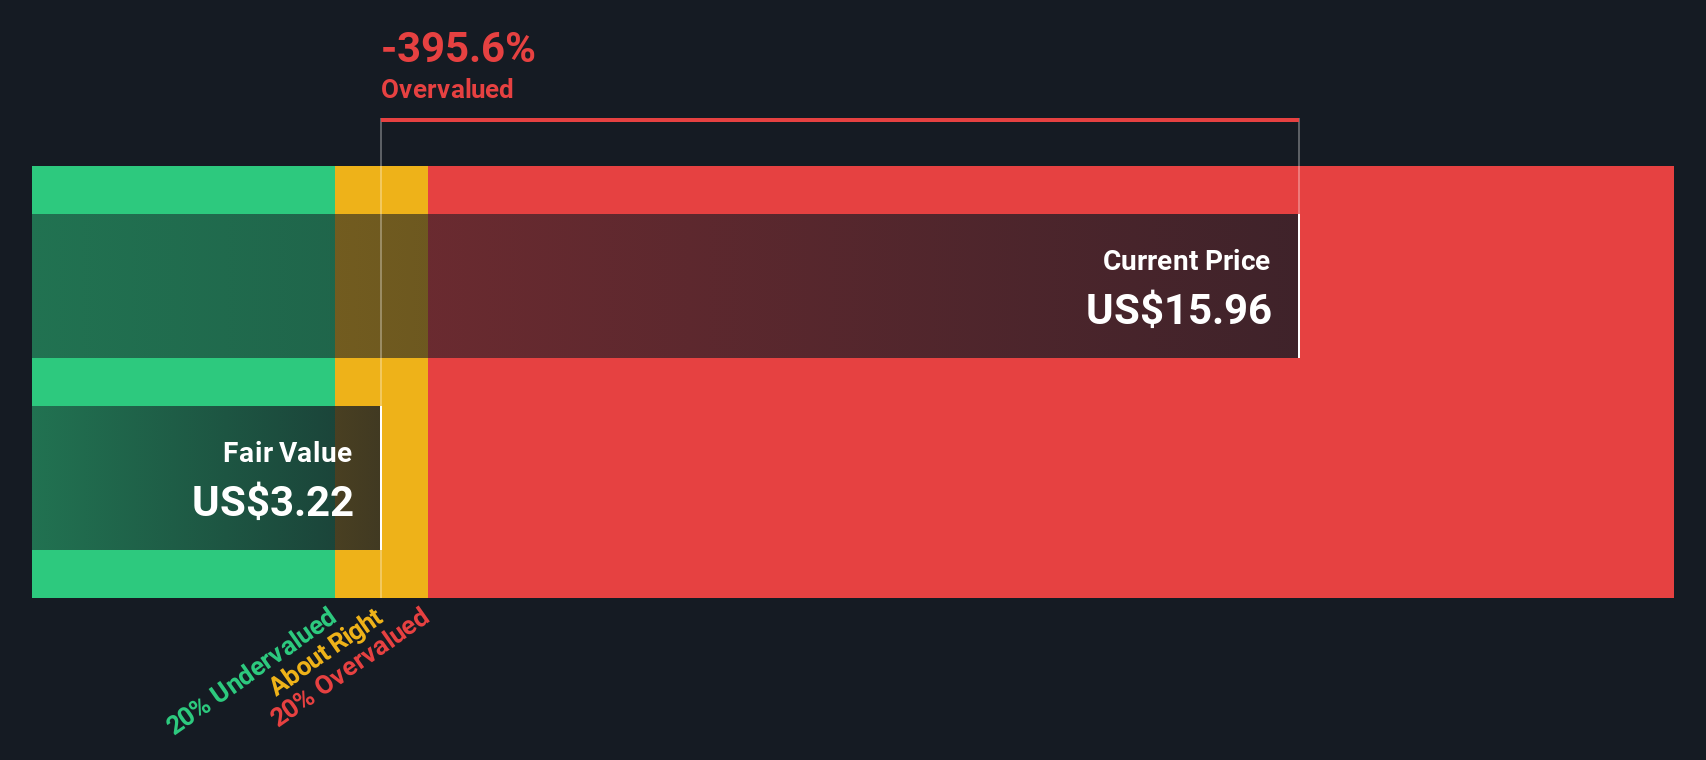
While the 2.7x P/B suggests Denali is roughly in line with the broader US biotech group, our DCF model points to an estimated fair value of about US$31.78 per share versus the current US$16.27 price. This implies it is trading at a sizeable discount. Is this a margin of safety or a value trap in a still loss making business?
Look into how the SWS DCF model arrives at its fair value.
Simply Wall St performs a discounted cash flow (DCF) on every stock in the world every day (check out Denali Therapeutics for example). We show the entire calculation in full. You can track the result in your watchlist or portfolio and be alerted when this changes, or use our stock screener to discover 870 undervalued stocks based on their cash flows. If you save a screener we even alert you when new companies match - so you never miss a potential opportunity.
Build Your Own Denali Therapeutics Narrative
If you see the numbers differently or prefer to test your own assumptions instead of relying on this view, you can build a full Denali thesis in just a few minutes, starting with Do it your way.
A great starting point for your Denali Therapeutics research is our analysis highlighting 3 key rewards and 2 important warning signs that could impact your investment decision.
Looking for more investment ideas?
If Denali has sharpened your focus, do not stop here. The next strong idea you find could matter more than the last one you missed.
- Scan for beaten down opportunities where expectations look low and cash flows still matter by checking out these 870 undervalued stocks based on cash flows.
- Spot companies applying AI to real world healthcare problems by starting with these 29 healthcare AI stocks.
- Hunt for high yielding income ideas that go beyond cash in the bank with these 14 dividend stocks with yields > 3%.
This article by Simply Wall St is general in nature. We provide commentary based on historical data and analyst forecasts only using an unbiased methodology and our articles are not intended to be financial advice. It does not constitute a recommendation to buy or sell any stock, and does not take account of your objectives, or your financial situation. We aim to bring you long-term focused analysis driven by fundamental data. Note that our analysis may not factor in the latest price-sensitive company announcements or qualitative material. Simply Wall St has no position in any stocks mentioned.
Have feedback on this article? Concerned about the content? Get in touch with us directly. Alternatively, email editorial-team@simplywallst.com