
Chord Energy (CHRD) Valuation Check As Shares Show Mixed Recent Returns
Why Chord Energy Is Getting Attention Now
Chord Energy (CHRD) has been drawing fresh interest as investors reassess US onshore oil and gas producers. The stock recently closed at US$94.68 and has shown mixed return patterns over the past year and the past 3 months.
See our latest analysis for Chord Energy.
Recent trading has been choppy, with a 1-day share price return of 2.14% and a 7-day share price return of 3.71%, alongside a 1-year total shareholder return decline of 18.24%. This combination suggests that near-term momentum is improving while longer-term returns have been weaker.
If Chord Energy has you reassessing the energy space, it can be useful to compare with other producers and related names using aerospace and defense stocks as a starting universe.
With Chord Energy trading at US$94.68 alongside an intrinsic discount estimate of 75% and a 35% gap to the average analyst price target, you have to ask: is this a mispriced value, or is the market already baking in future growth?
Most Popular Narrative: 25.8% Undervalued
Against the last close of US$94.68, the most followed narrative anchors fair value at US$127.56, framing Chord Energy as materially discounted on intrinsic terms.
Chord's high-quality, low-breakeven asset base in the Williston Basin, coupled with underinvestment in new global oil supply and the slow pace of the energy transition, supports sustained strong demand for U.S. shale oil, bolstering long-term revenue and price realizations.
Curious what earnings path, margin shift and valuation multiple are built into that view, and how buybacks shape the per share math? The full narrative walks through the revenue profile, margin reset and future P/E assumption that underpin the US$127.56 fair value.
Result: Fair Value of $127.56 (UNDERVALUED)
Have a read of the narrative in full and understand what's behind the forecasts.
However, this hinges on a concentrated Williston Basin footprint and unconventional shale wells that require ongoing drilling, which could pressure margins if conditions turn less favorable.
Find out about the key risks to this Chord Energy narrative.
Another Angle On Chord Energy's Valuation
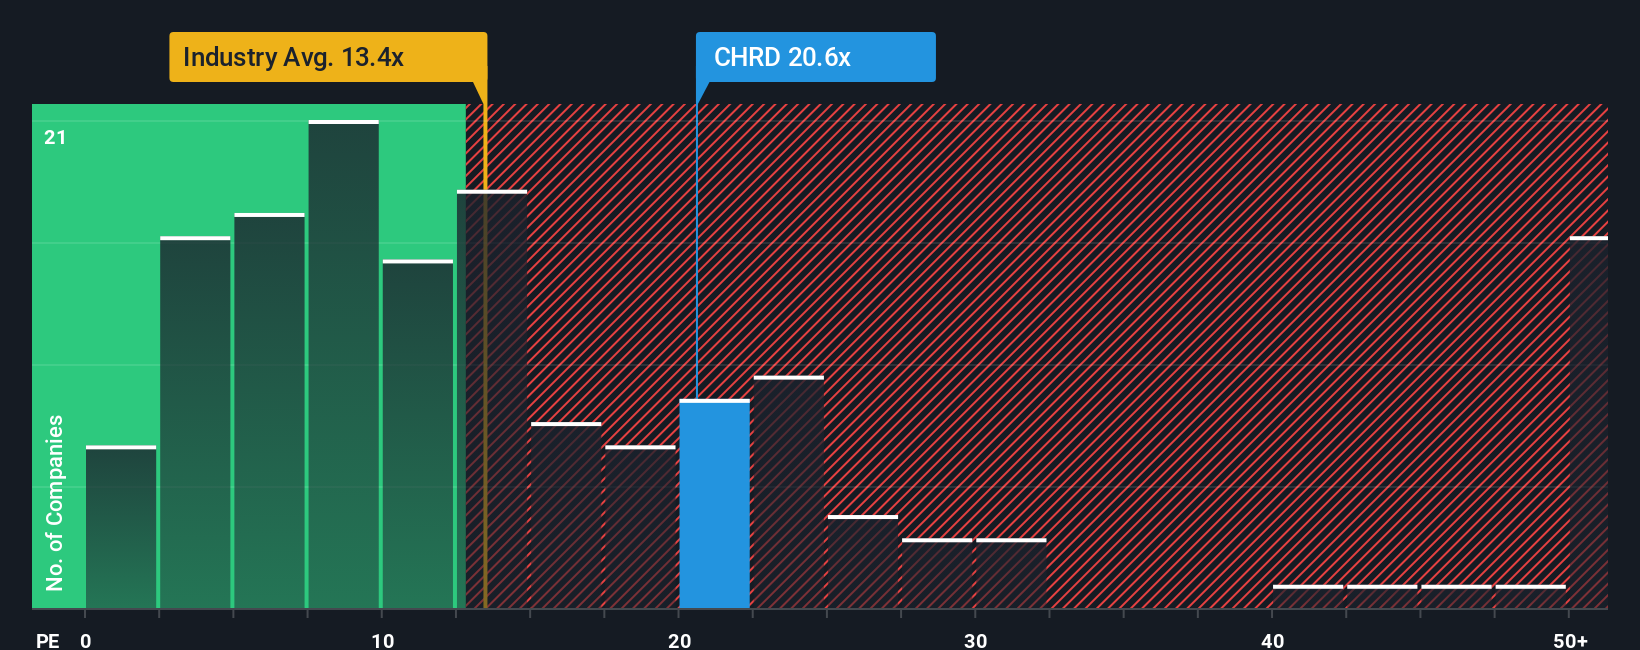
The narrative points to a 25.8% gap to fair value, but Chord’s current P/E of 32x tells a different story. It sits above the US Oil and Gas industry at 13.2x and the fair ratio of 22.8x, even though it is below peer averages of 37.3x.
That mix of signals suggests some investors are already paying up for future growth. The key consideration is whether you see more potential upside in the story, or instead more scope for the market to pull that richer multiple closer to the fair ratio.
See what the numbers say about this price — find out in our valuation breakdown.
Build Your Own Chord Energy Narrative
If you see the numbers differently or prefer to test your own assumptions, you can build a fresh narrative yourself in just a few minutes, starting with Do it your way.
A great starting point for your Chord Energy research is our analysis highlighting 3 key rewards and 3 important warning signs that could impact your investment decision.
Looking for more investment ideas?
If Chord Energy has sparked your interest, do not stop here. Put the same curiosity to work across other opportunities that fit your style and risk comfort.
- Hunt for potential bargains by scanning these 870 undervalued stocks based on cash flows that currently trade at a discount to their cash flow profiles.
- Spot early trends in emerging technologies by checking out these 25 AI penny stocks that are tied to artificial intelligence themes.
- Target income-focused opportunities by reviewing these 14 dividend stocks with yields > 3% that pay yields above 3%.
This article by Simply Wall St is general in nature. We provide commentary based on historical data and analyst forecasts only using an unbiased methodology and our articles are not intended to be financial advice. It does not constitute a recommendation to buy or sell any stock, and does not take account of your objectives, or your financial situation. We aim to bring you long-term focused analysis driven by fundamental data. Note that our analysis may not factor in the latest price-sensitive company announcements or qualitative material. Simply Wall St has no position in any stocks mentioned.
Have feedback on this article? Concerned about the content? Get in touch with us directly. Alternatively, email editorial-team@simplywallst.com