
Undiscovered Gems in the US Market to Explore This January 2026
As the U.S. market kicks off 2026, major indices like the Dow Jones and S&P 500 are experiencing significant gains, buoyed by geopolitical events such as the capture of Venezuelan President Maduro. Amidst this backdrop of rising energy shares and fluctuating economic indicators, investors may find opportunities in lesser-known stocks that exhibit strong fundamentals and potential for growth within a dynamic market environment.
Top 10 Undiscovered Gems With Strong Fundamentals In The United States
| Name | Debt To Equity | Revenue Growth | Earnings Growth | Health Rating |
|---|---|---|---|---|
| Oakworth Capital | 40.91% | 15.96% | 11.47% | ★★★★★★ |
| Senstar Technologies | NA | -15.82% | 43.55% | ★★★★★★ |
| Security Federal | 20.04% | 5.77% | 1.59% | ★★★★★★ |
| Franklin Financial Services | 127.01% | 5.48% | -4.56% | ★★★★★★ |
| Affinity Bancshares | 43.06% | 2.84% | 3.44% | ★★★★★★ |
| ASA Gold and Precious Metals | NA | 13.18% | 16.77% | ★★★★★☆ |
| Seneca Foods | 41.64% | 2.31% | -23.77% | ★★★★★☆ |
| Pure Cycle | 4.76% | 6.42% | -1.58% | ★★★★★☆ |
| FRMO | 0.10% | 35.28% | 40.61% | ★★★★★☆ |
| Union Bankshares | 369.65% | 1.12% | -7.45% | ★★★★☆☆ |
Here we highlight a subset of our preferred stocks from the screener.
Isabella Bank (ISBA)
Simply Wall St Value Rating: ★★★★★★
Overview: Isabella Bank Corporation, with a market cap of $368.96 million, functions as the bank holding company for Isabella Bank, offering banking and wealth management services to businesses, institutions, and individuals in Michigan.
Operations: Isabella Bank Corporation generates revenue primarily from its retail banking operations, totaling $76.49 million.
Isabella Bank, with total assets of $2.3 billion and equity of $227.4 million, showcases a robust financial profile. Its total deposits stand at $1.9 billion against loans of $1.4 billion, reflecting prudent management with a bad loan allowance at 380% and non-performing loans at just 0.2%. The bank's earnings growth outpaced the industry last year, rising by 33%, while maintaining primarily low-risk funding sources for liabilities (95%). Recently, Isabella announced a quarterly dividend of US$0.28 per share and completed significant share repurchases worth US$64.23 million under its long-term buyback program initiated in 2007.
- Click to explore a detailed breakdown of our findings in Isabella Bank's health report.
Gain insights into Isabella Bank's historical performance by reviewing our past performance report.

Jiayin Group (JFIN)
Simply Wall St Value Rating: ★★★★★★
Overview: Jiayin Group Inc., with a market cap of approximately $321.28 million, operates in the People's Republic of China, providing online consumer finance services through its subsidiaries.
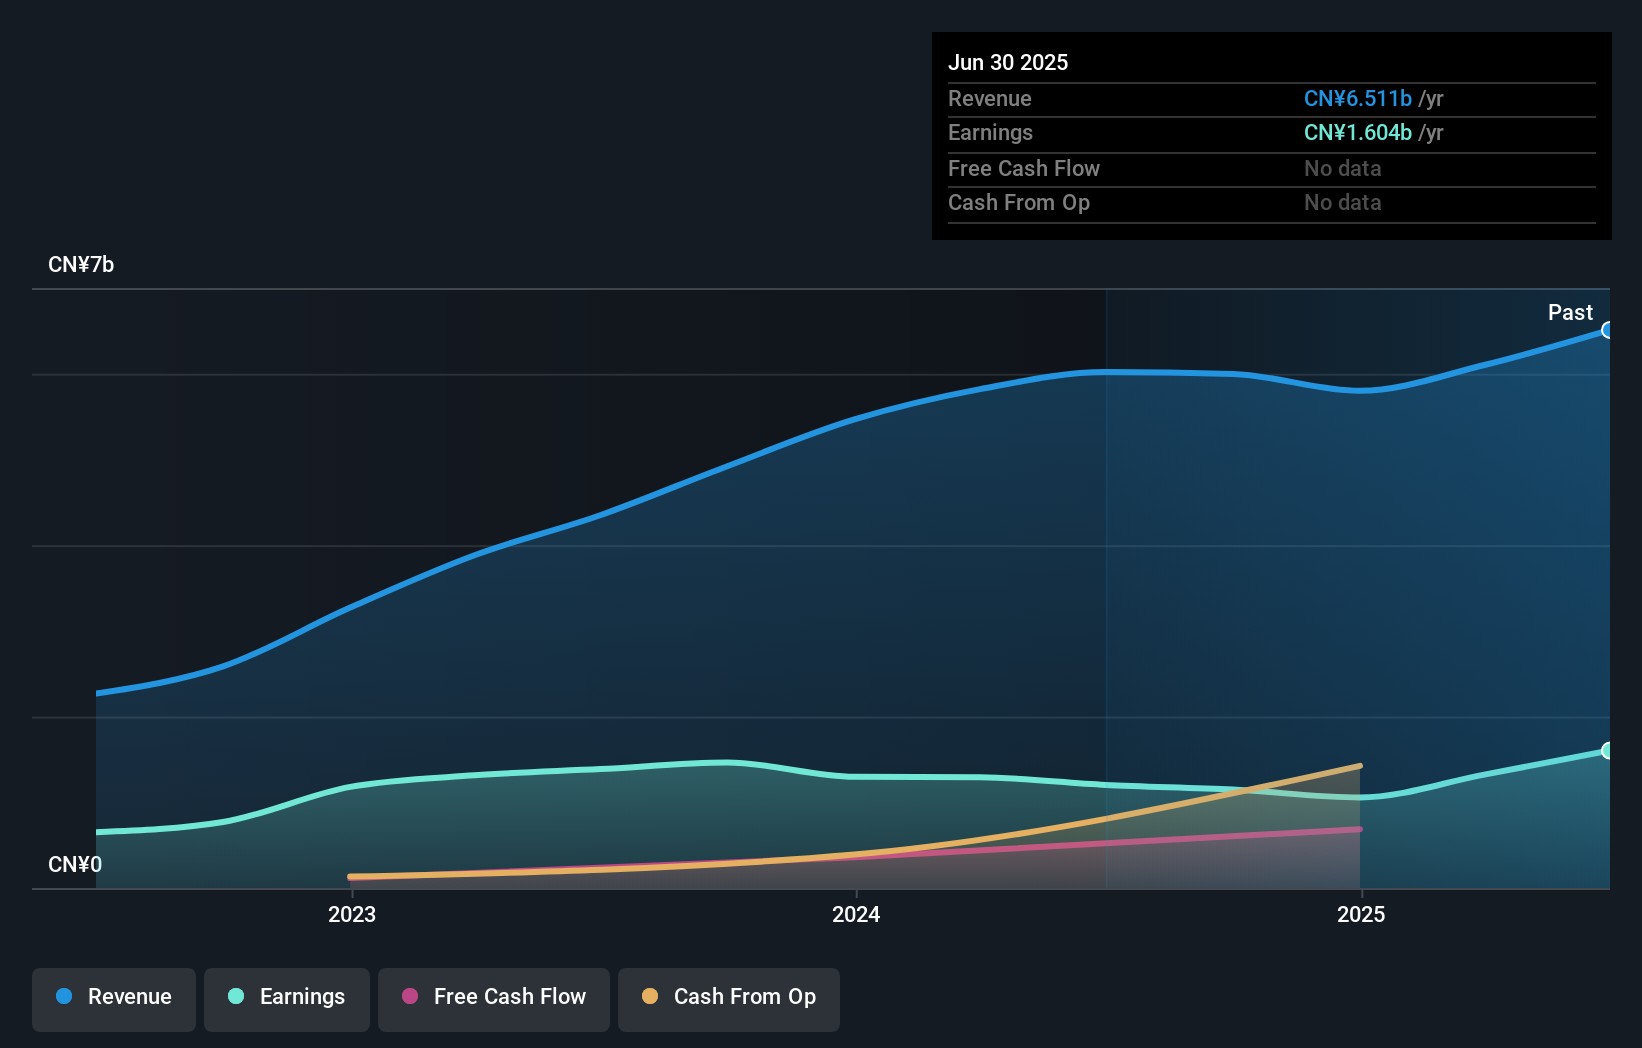
Operations: Jiayin Group generates revenue primarily from online consumer finance services, reporting CN¥6.54 billion in this segment. The company's financial performance is characterized by its net profit margin trends over recent periods.
Jiayin Group, a nimble player in the consumer finance sector, showcases robust financial health with zero debt over the past five years and strong earnings growth of 48.9% last year, outpacing industry norms. The company reported impressive Q3 2025 results with net income reaching CNY 376.49 million (US$54.91 million), up from CNY 269.61 million (US$39.30 million) year-on-year, while basic earnings per share climbed to CNY 7.32 from CNY 5.08 previously. Trading at a significant discount to its estimated fair value suggests potential upside for investors seeking undervalued opportunities in this space.
- Click here and access our complete health analysis report to understand the dynamics of Jiayin Group.
Understand Jiayin Group's track record by examining our Past report.
Xunlei (XNET)
Simply Wall St Value Rating: ★★★★★★
Overview: Xunlei Limited, with a market cap of $455.87 million, operates an internet platform for digital media content in the People's Republic of China through its subsidiaries.
Operations: The company generates revenue primarily from the operation of its online media platform, contributing $401.92 million.
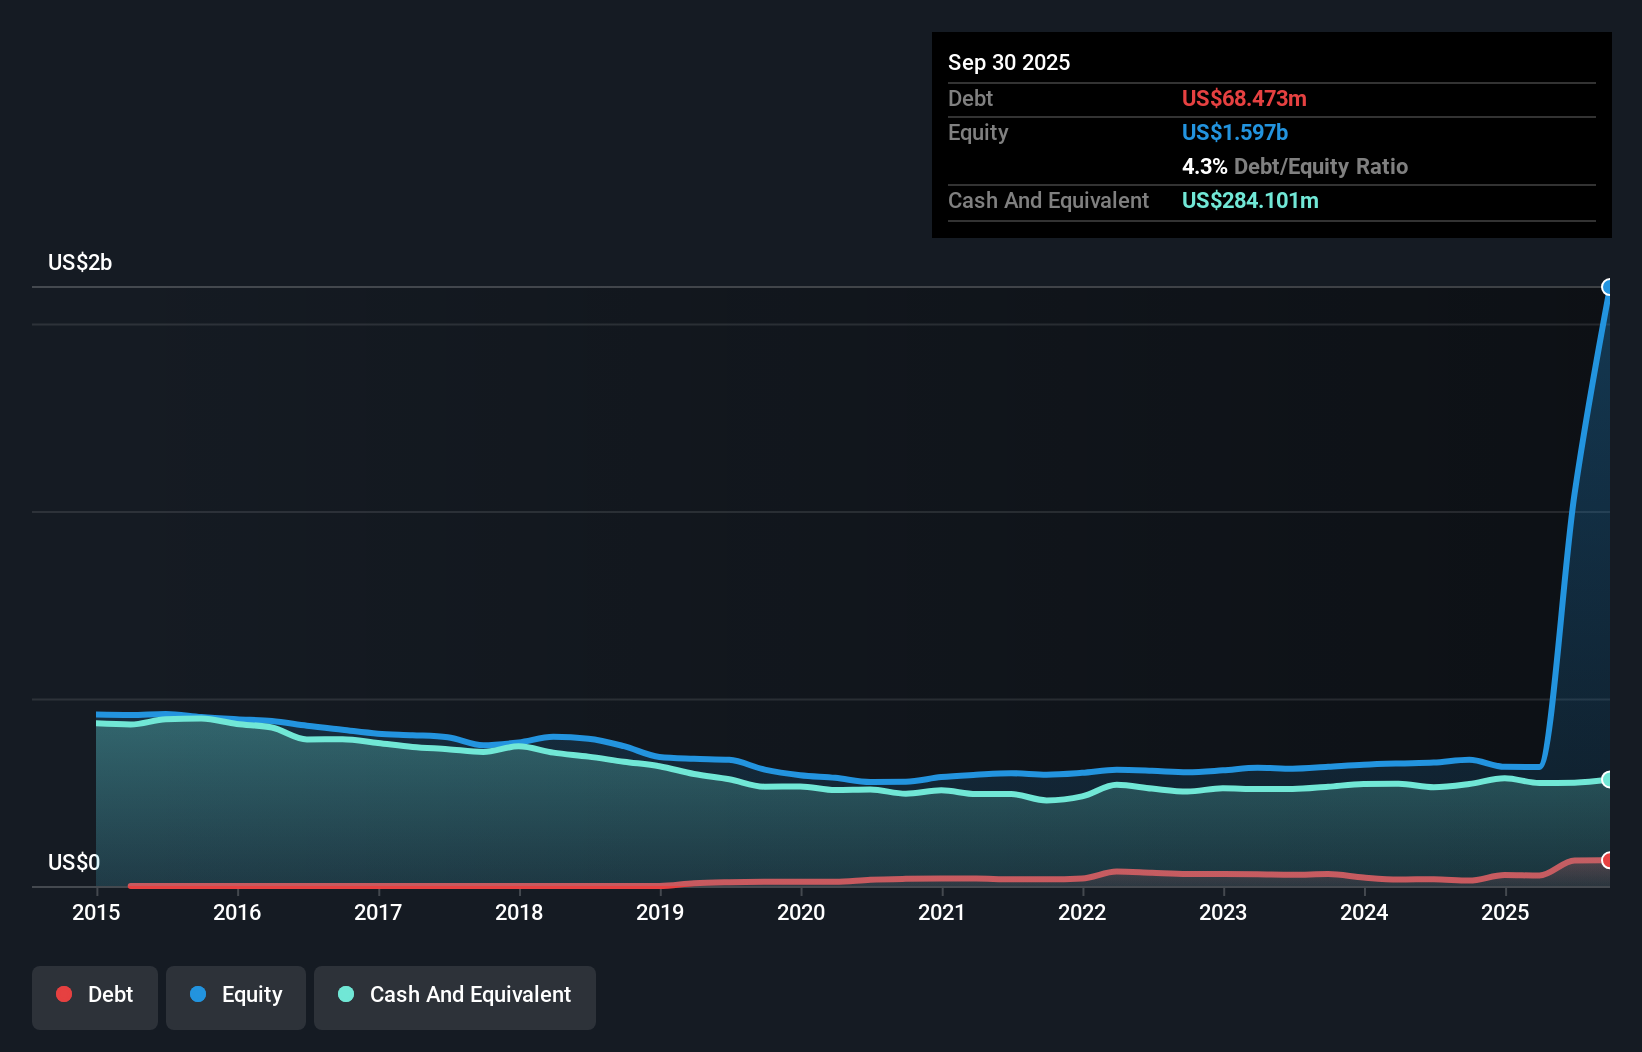
Xunlei's recent performance showcases its potential, with earnings skyrocketing by 8524% over the past year, significantly outpacing the software industry's 28.3% growth. The company reported a net income of US$550.25 million for Q3 2025, up from US$4.6 million a year ago, driven partly by a substantial one-off gain of US$524.7 million. Xunlei also boasts more cash than total debt and has reduced its debt-to-equity ratio from 6.9 to 4.3 over five years, suggesting prudent financial management despite large non-recurring items impacting results and trading slightly below estimated fair value at present.
- Dive into the specifics of Xunlei here with our thorough health report.
Evaluate Xunlei's historical performance by accessing our past performance report.
Turning Ideas Into Actions
- Delve into our full catalog of 302 US Undiscovered Gems With Strong Fundamentals here.
- Have you diversified into these companies? Leverage the power of Simply Wall St's portfolio to keep a close eye on market movements affecting your investments.
- Elevate your portfolio with Simply Wall St, the ultimate app for investors seeking global market coverage.
Looking For Alternative Opportunities?
- Explore high-performing small cap companies that haven't yet garnered significant analyst attention.
- Fuel your portfolio with companies showing strong growth potential, backed by optimistic outlooks both from analysts and management.
- Find companies with promising cash flow potential yet trading below their fair value.
This article by Simply Wall St is general in nature. We provide commentary based on historical data and analyst forecasts only using an unbiased methodology and our articles are not intended to be financial advice. It does not constitute a recommendation to buy or sell any stock, and does not take account of your objectives, or your financial situation. We aim to bring you long-term focused analysis driven by fundamental data. Note that our analysis may not factor in the latest price-sensitive company announcements or qualitative material. Simply Wall St has no position in any stocks mentioned.
Have feedback on this article? Concerned about the content? Get in touch with us directly. Alternatively, email editorial-team@simplywallst.com