
Brookfield Asset Management (TSX:BAM) Valuation Check After Recent Share Price Volatility
Brookfield Asset Management (TSX:BAM) has been drawing attention after recent share price moves, with the stock up around 2% over the past day but showing a negative return over the past 3 months.
See our latest analysis for Brookfield Asset Management.
The recent 2.1% 1 day share price return to $73.39 comes after a softer patch, with a 90 day share price return of 9.3% decline and a 1 year total shareholder return of 3.7% decline. This suggests momentum has been fading even though the 3 year total shareholder return of about 96% still points to a strong longer term outcome.
If Brookfield’s recent swings have you reassessing your options, it could be a good moment to broaden your watchlist and check out fast growing stocks with high insider ownership.
So with Brookfield posting double digit annual revenue and net income growth, yet trading around CA$73.39 with a low value score, should you see mispricing here or is the market already factoring in its future growth?
Price-to-Earnings of 32.9x: Is it justified?
On a P/E of 32.9x at a CA$73.39 share price, Brookfield Asset Management trades at a clear premium to both its fair P/E estimate and its industry.
The P/E ratio compares the current share price to earnings per share, so a higher multiple usually signals that the market is paying up for current and expected profitability.
For Brookfield, this higher P/E sits alongside high quality earnings, strong recent profit growth, and a Return on Equity of 23.1%, which can help explain why investors are willing to ascribe a richer earnings multiple. However, our fair P/E estimate of 23.7x implies a lower level the market could potentially move toward if expectations cool.
Against the wider Canadian Capital Markets industry average P/E of 9.3x, Brookfield’s 32.9x stands out as materially higher, indicating investors are placing a much richer price tag on its earnings than the sector benchmark and even above the fair ratio level implied by our analysis.
Explore the SWS fair ratio for Brookfield Asset Management
Result: Price-to-Earnings of 32.9x (OVERVALUED)
However, a 9.3% 90 day share price decline and a value score of 1 hint that sentiment could sour further if expectations for growth or profitability change.
Find out about the key risks to this Brookfield Asset Management narrative.
Another View: What Does The DCF Say?
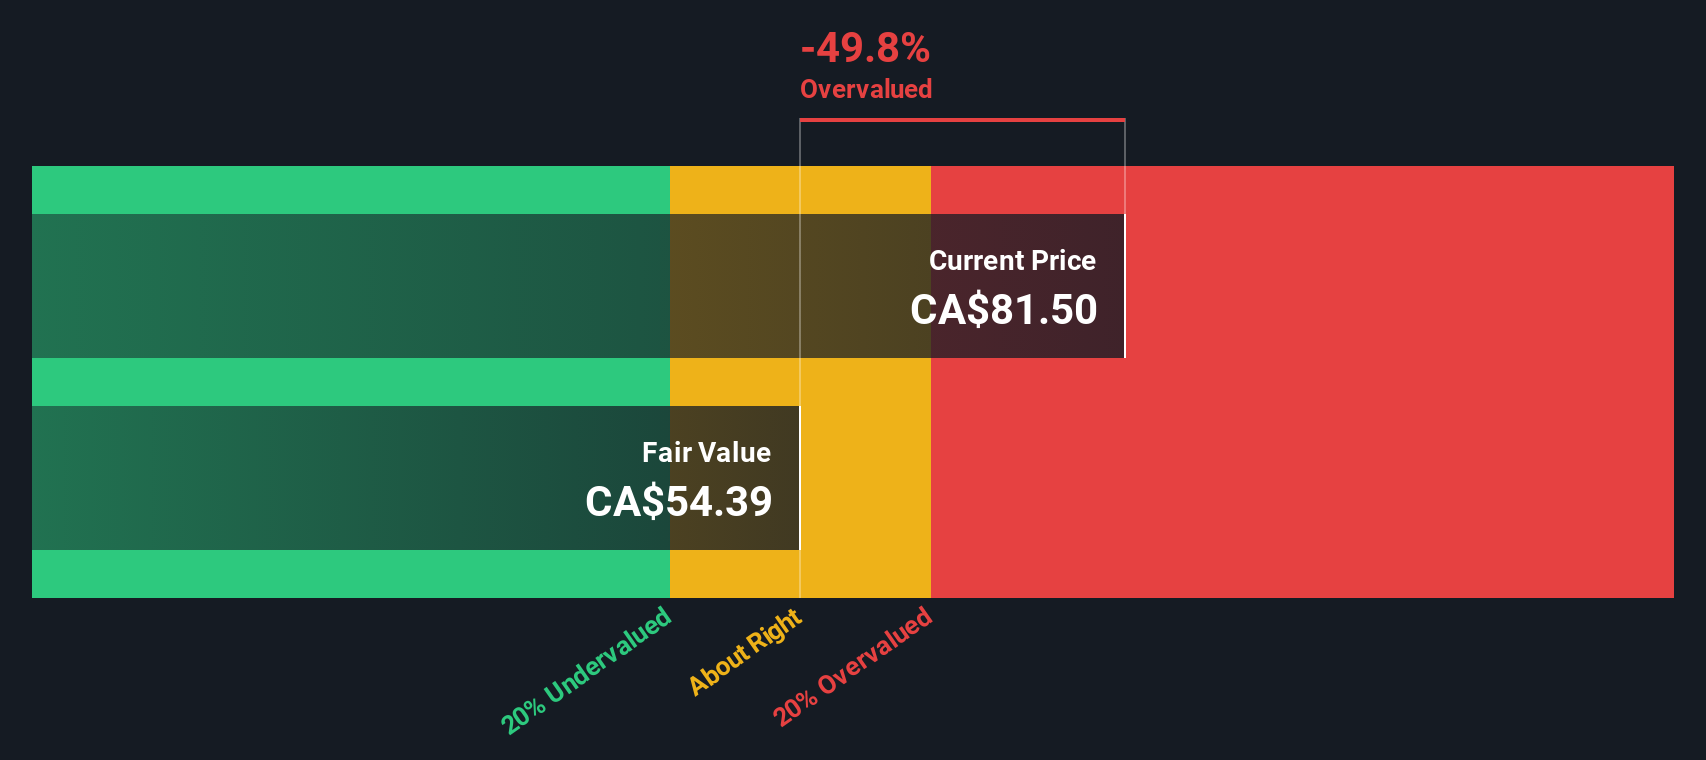
While the current 32.9x P/E suggests Brookfield Asset Management is expensive relative to its fair ratio and industry, our DCF model also points to a rich price. With the shares at CA$73.39 versus an estimate of fair value at CA$56.57, the stock screens as overvalued on this approach too. If both earnings and cash flow views are flagging a full price, what would need to change for that picture to shift?
Look into how the SWS DCF model arrives at its fair value.
Simply Wall St performs a discounted cash flow (DCF) on every stock in the world every day (check out Brookfield Asset Management for example). We show the entire calculation in full. You can track the result in your watchlist or portfolio and be alerted when this changes, or use our stock screener to discover 876 undervalued stocks based on their cash flows. If you save a screener we even alert you when new companies match - so you never miss a potential opportunity.
Build Your Own Brookfield Asset Management Narrative
If you see the numbers differently, or simply prefer to work through the data yourself, you can build a tailored Brookfield view in minutes: Do it your way.
A great starting point for your Brookfield Asset Management research is our analysis highlighting 2 key rewards and 2 important warning signs that could impact your investment decision.
Looking for more investment ideas?
If Brookfield is already on your radar, do not stop there. Use the Simply Wall St Screener to quickly surface other clear, data driven opportunities before the crowd.
- Spot potential bargains early by filtering for companies screened as undervalued on cash flows using these 876 undervalued stocks based on cash flows so you do not miss pricing that could be attractive.
- Back big themes by focusing on growing AI opportunities through these 25 AI penny stocks and put companies tied to powerful tech shifts on your watchlist first.
- Target dependable income ideas by scanning these 14 dividend stocks with yields > 3% and quickly find yields above 3% that might fit a steady, cash focused approach.
This article by Simply Wall St is general in nature. We provide commentary based on historical data and analyst forecasts only using an unbiased methodology and our articles are not intended to be financial advice. It does not constitute a recommendation to buy or sell any stock, and does not take account of your objectives, or your financial situation. We aim to bring you long-term focused analysis driven by fundamental data. Note that our analysis may not factor in the latest price-sensitive company announcements or qualitative material. Simply Wall St has no position in any stocks mentioned.
Have feedback on this article? Concerned about the content? Get in touch with us directly. Alternatively, email editorial-team@simplywallst.com