
Alps Alpine (TSE:6770) Valuation Check After Recent Share Price Moves
Alps Alpine (TSE:6770) is back on investors’ radar after recent share price moves, with the stock trading around ¥1,997 as the market reassesses its electronics and automotive exposure.
See our latest analysis for Alps Alpine.
That move to around ¥1,997 comes after a mixed few months for the share price, with a 30 day share price return of a 4.15% decline, a 90 day gain of 3.69%, a 1 year total shareholder return of 31.54%, and a 3 year total shareholder return of 81.44%, all pointing to momentum that has built over a longer period.
If Alps Alpine has you looking at the broader auto and electronics supply chain, it could be worth scanning auto manufacturers for other names on the move.
So with Alps Alpine sitting around ¥1,997 after strong multi year returns, but analyst targets and intrinsic estimates pointing lower, is the market missing something or already pricing in all the future growth here?
Price to Earnings of 8x: Is it justified?
On a P/E of 8x, Alps Alpine looks inexpensive against many reference points, despite the last close price sitting at ¥1,997.
The P/E ratio compares today’s share price with earnings per share, so it helps you see how much investors are paying for each ¥ of profit. For an electronics and auto components group like Alps Alpine, this is a common yardstick because earnings are a key focus for many investors.
According to the statements, the current P/E of 8x is below the broader JP market P/E of 14.5x, and also below the estimated fair P/E of 11.4x that our fair ratio work points to. That suggests the level the multiple could move toward if the market were to price the company more in line with those relationships.
The gap is even clearer when you compare Alps Alpine with the JP Electronic industry and a direct peer set. The stock’s 8x P/E sits well under the JP Electronic industry average of 15x, and far below the peer average P/E of 44.7x, a very large premium over where Alps Alpine trades today.
Explore the SWS fair ratio for Alps Alpine
Result: Price-to-earnings of 8x (UNDERVALUED)
However, you do need to weigh weaker annual revenue and net income trends alongside a share price that already sits above both analyst targets and intrinsic estimates.
Find out about the key risks to this Alps Alpine narrative.
Another view from the SWS DCF model
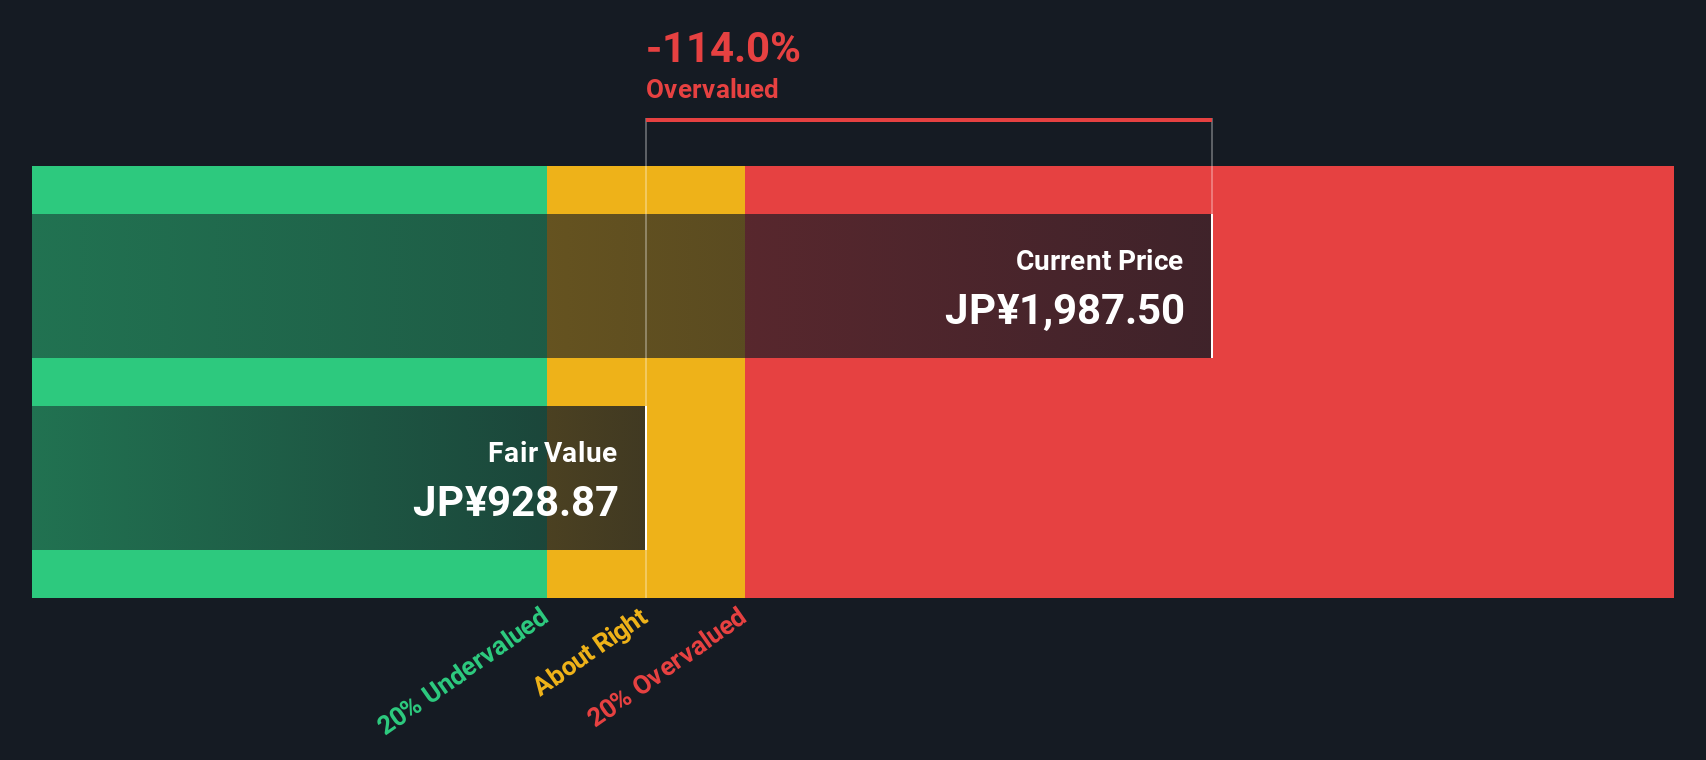
The P/E of 8x presents Alps Alpine as inexpensive, but our DCF model suggests a different perspective. On that framework, the current share price of ¥1,997 sits above an estimated fair value of ¥926.26, which indicates that the stock may be overvalued on a cash flow basis.
If earnings and cash flows align more closely with the DCF assumptions rather than the P/E relationships, the apparent value case could be thinner than it first appears. This raises the question of which lens to rely on more for a business that has just turned profitable and includes one-off items in recent results.
Look into how the SWS DCF model arrives at its fair value.
Simply Wall St performs a discounted cash flow (DCF) on every stock in the world every day (check out Alps Alpine for example). We show the entire calculation in full. You can track the result in your watchlist or portfolio and be alerted when this changes, or use our stock screener to discover 876 undervalued stocks based on their cash flows. If you save a screener we even alert you when new companies match - so you never miss a potential opportunity.
Build Your Own Alps Alpine Narrative
If you look at these numbers and reach a different conclusion, or just prefer to test the inputs yourself, you can build a custom view in minutes with Do it your way.
A great starting point for your Alps Alpine research is our analysis highlighting 3 key rewards and 3 important warning signs that could impact your investment decision.
Looking for more investment ideas?
If Alps Alpine has sharpened your focus on valuations and future potential, do not stop here. The next opportunity could be sitting in plain sight.
- Spot potential bargains early by scanning these 876 undervalued stocks based on cash flows that currently trade below what their cash flows might suggest they are worth.
- Ride powerful technology trends by checking out these 25 AI penny stocks that are shaping how artificial intelligence reaches everyday products and services.
- Target income focused ideas by reviewing these 14 dividend stocks with yields > 3% that offer yields above 3% and could complement more growth heavy positions.
This article by Simply Wall St is general in nature. We provide commentary based on historical data and analyst forecasts only using an unbiased methodology and our articles are not intended to be financial advice. It does not constitute a recommendation to buy or sell any stock, and does not take account of your objectives, or your financial situation. We aim to bring you long-term focused analysis driven by fundamental data. Note that our analysis may not factor in the latest price-sensitive company announcements or qualitative material. Simply Wall St has no position in any stocks mentioned.
Have feedback on this article? Concerned about the content? Get in touch with us directly. Alternatively, email editorial-team@simplywallst.com