
A Look At Viking Therapeutics (VKTX) Valuation As Long Term Gains Contrast Recent Losses
Viking Therapeutics (VKTX) has drawn fresh attention after recent trading left the stock at a last close of $35.42, with performance mixed between short term pressure and stronger gains over the past 3 months.
See our latest analysis for Viking Therapeutics.
Looking beyond the latest move, Viking Therapeutics shows mixed momentum, with a 1 day share price return of 0.68% set against a 30 day share price return of an 8.12% decline and a 1 year total shareholder return of a 16.72% loss. The 3 year total shareholder return is about 3x and the 5 year total shareholder return is more than 4x, suggesting long term holders have experienced very strong gains even as recent trading reflects shifting expectations about growth prospects and risk.
If you are assessing Viking’s recent swings and want a broader view of the sector, this could be a good moment to compare it with other healthcare stocks.
With Viking still loss making and trading at a steep discount to some analyst targets, the key question is whether the current price underestimates its drug pipeline or if the market already reflects the growth ahead.
Price To Book Of 5.6x: Is It Justified?
On a P/B of 5.6x versus the US biotech average of 2.7x, Viking Therapeutics trades at a materially richer level than the broader group despite remaining loss making.
P/B compares a company’s market value to its net assets, which matters a lot for a business like Viking that currently reports $0 revenue and a net loss of $237.4m. In this context, a higher multiple often reflects how much investors are willing to pay today for a pipeline and future optionality rather than current earnings power.
Here, the 5.6x P/B sits below the 7.9x peer average cited in the data, yet clearly above the wider US biotech industry at 2.7x. That mix presents a picture of a company priced above the typical biotech on a balance sheet basis, while still trading at a discount to a closer peer set where expectations for future outcomes appear even more optimistic.
See what the numbers say about this price — find out in our valuation breakdown.
Result: Price-to-book of 5.6x (ABOUT RIGHT)
However, there are clear pressure points here, including ongoing losses of $237.4m and clinical trial outcomes that could shift sentiment around the entire drug pipeline.
Find out about the key risks to this Viking Therapeutics narrative.
Another View: DCF Paints A Very Different Picture
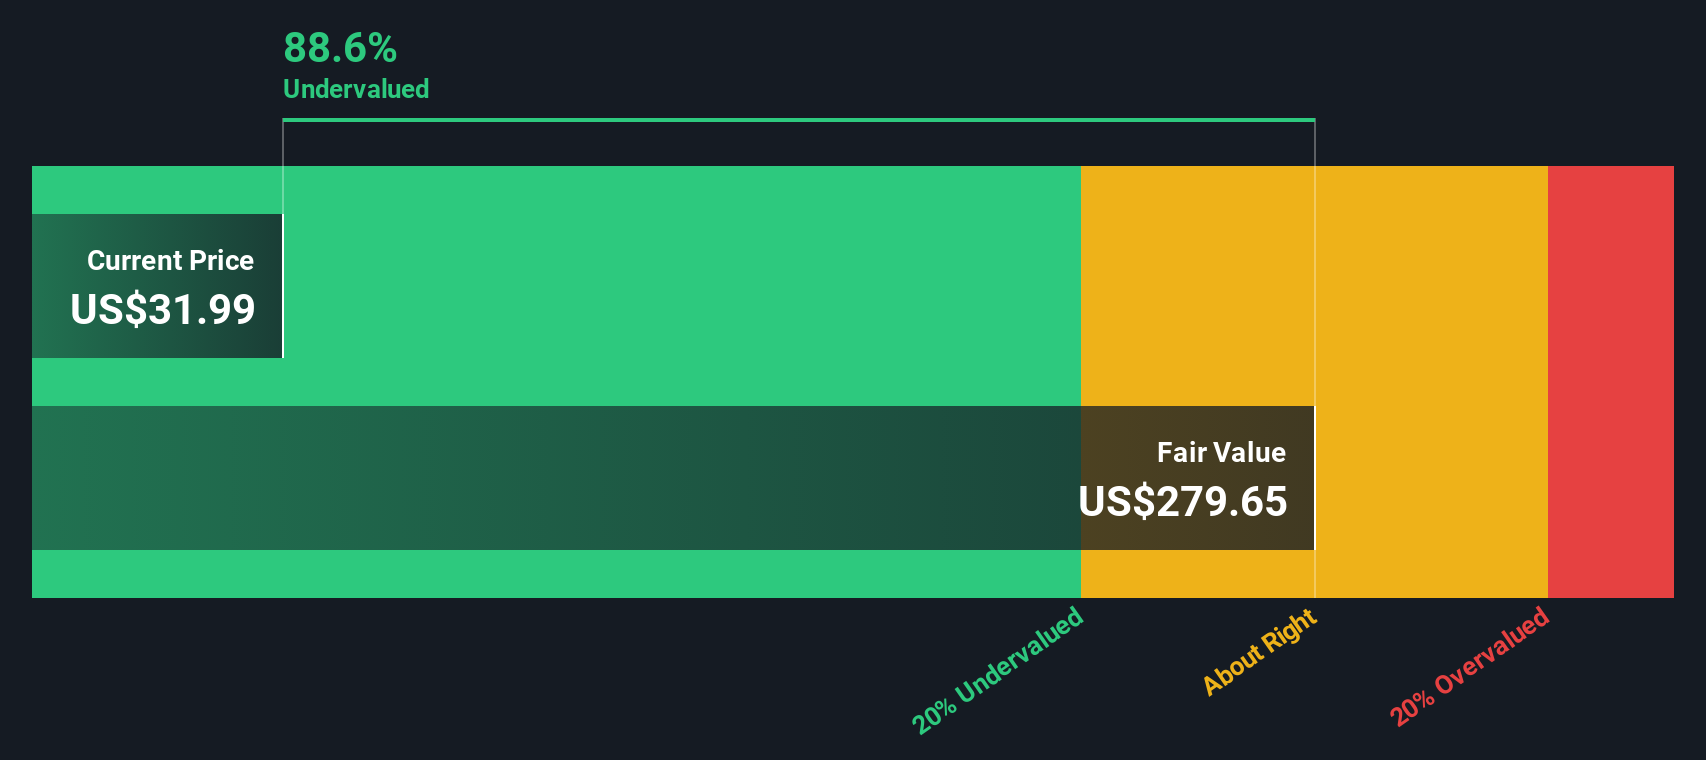
While the 5.6x P/B suggests Viking Therapeutics is expensive relative to the wider US biotech group, our DCF model indicates a very different picture. On that approach, the current US$35.42 share price is about 87.4% below an estimated fair value of US$281.23.
This gap between a rich balance sheet multiple and a very large DCF upside estimate highlights how sensitive Viking’s value is to long term assumptions about its drug pipeline. The key question for you is which set of assumptions appears more realistic given the company’s lack of revenue and ongoing losses.
Look into how the SWS DCF model arrives at its fair value.
Simply Wall St performs a discounted cash flow (DCF) on every stock in the world every day (check out Viking Therapeutics for example). We show the entire calculation in full. You can track the result in your watchlist or portfolio and be alerted when this changes, or use our stock screener to discover 875 undervalued stocks based on their cash flows. If you save a screener we even alert you when new companies match - so you never miss a potential opportunity.
Build Your Own Viking Therapeutics Narrative
If you look at this and feel differently, or prefer to rely on your own view of the numbers, you can build a personalised thesis in just a few minutes, starting with Do it your way.
A great starting point for your Viking Therapeutics research is our analysis highlighting 1 key reward and 3 important warning signs that could impact your investment decision.
Looking For More Investment Ideas?
If Viking is only one piece of your watchlist, this is the moment to widen your search before other investors spot the same opportunities.
- Target potential high-upside ideas by scanning these 3564 penny stocks with strong financials that pair smaller market caps with stronger balance sheets and fundamentals than you might expect.
- Position yourself at the front of the AI wave by reviewing these 25 AI penny stocks that connect artificial intelligence themes with early stage pricing.
- Focus on price and cash flow discipline by checking these 875 undervalued stocks based on cash flows that align current valuations more closely with underlying business earnings potential.
This article by Simply Wall St is general in nature. We provide commentary based on historical data and analyst forecasts only using an unbiased methodology and our articles are not intended to be financial advice. It does not constitute a recommendation to buy or sell any stock, and does not take account of your objectives, or your financial situation. We aim to bring you long-term focused analysis driven by fundamental data. Note that our analysis may not factor in the latest price-sensitive company announcements or qualitative material. Simply Wall St has no position in any stocks mentioned.
Have feedback on this article? Concerned about the content? Get in touch with us directly. Alternatively, email editorial-team@simplywallst.com