
Assessing Blue Owl Capital (OWL) Valuation After Liquidity Lawsuits And Restricted Redemptions
Recent class action filings against Blue Owl Capital (OWL) focus on allegations of undisclosed liquidity pressures tied to business development company redemptions and restrictions in a private credit fund, putting investor access and sentiment under closer review.
See our latest analysis for Blue Owl Capital.
The legal actions arrive after a year where the share price return has been mixed, with a 3.66% year to date share price gain and 1 day and 7 day share price returns of 3.66% and 5.87% respectively, set against a 1 year total shareholder return decline of 26.69%. However, 3 and 5 year total shareholder returns of 55.87% and 72.57% suggest shorter term momentum has picked up while longer term holders still sit on gains overall.
If these developments have you reassessing risk in financial stocks, it could be a good moment to broaden your search and check out fast growing stocks with high insider ownership.
With Blue Owl shares down 26.69% over 1 year but still ahead over 3 and 5 years, and facing fresh legal scrutiny, is the current price a reset that creates opportunity or is the market already pricing in future growth?
Most Popular Narrative: 23.8% Undervalued
With Blue Owl Capital last closing at US$15.87 versus a narrative fair value of about US$20.82, the current share price sits well below that reference point. This puts the focus on how fee growth and margins might evolve from here.
Significant ongoing growth in permanent capital vehicles, particularly through expansion in private credit, real assets, and evergreen/interval fund strategies, is providing stable and recurring management fee revenue and positioning Blue Owl for higher future earnings and durable margin expansion.
Curious what kind of fee growth, margin profile, and valuation multiple need to line up to back up that higher fair value? The full narrative walks through the revenue path, profitability assumptions, and earnings power that underpin this gap to the current price.
Result: Fair Value of $20.82 (UNDERVALUED)
Have a read of the narrative in full and understand what's behind the forecasts.
However, this hinges on continued capital inflows and smooth fund integrations, and setbacks around fundraising momentum or acquisition execution could quickly challenge that view of underpriced upside.
Find out about the key risks to this Blue Owl Capital narrative.
Another View: SWS DCF Flags Rich Pricing
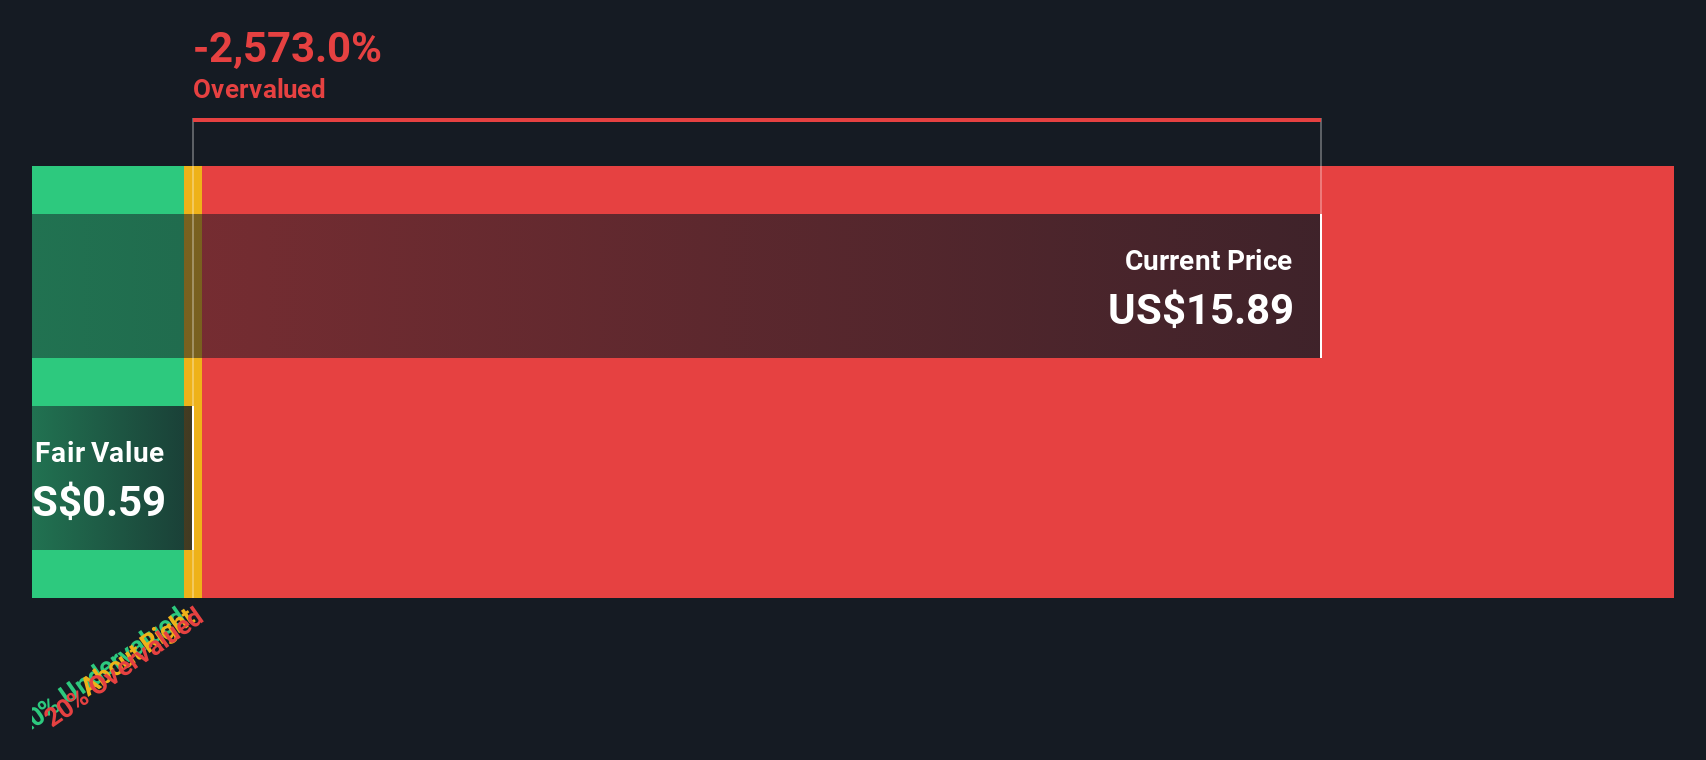
While the narrative fair value suggests Blue Owl Capital looks undervalued at around US$20.82 versus the US$15.87 share price, our DCF model paints a very different picture. On that framework, the stock trades well above an estimated fair value of about US$0.54, which points to meaningful downside risk if cash flows fall short.
Look into how the SWS DCF model arrives at its fair value.
When two valuation tools disagree this sharply, it raises a simple question for you as an investor: which set of assumptions about Blue Owl's future cash generation do you trust more, and why?
Simply Wall St performs a discounted cash flow (DCF) on every stock in the world every day (check out Blue Owl Capital for example). We show the entire calculation in full. You can track the result in your watchlist or portfolio and be alerted when this changes, or use our stock screener to discover 880 undervalued stocks based on their cash flows. If you save a screener we even alert you when new companies match - so you never miss a potential opportunity.
Build Your Own Blue Owl Capital Narrative
If you look at these numbers and reach a different conclusion, or simply want to test your own assumptions, you can build a bespoke story in minutes: Do it your way.
A great starting point for your Blue Owl Capital research is our analysis highlighting 1 key reward and 4 important warning signs that could impact your investment decision.
Looking for more investment ideas?
Do not stop at a single stock view here. Use the Simply Wall St Screener to quickly surface fresh ideas that fit the kind of portfolio you want to build.
- Spot potential value opportunities by checking out these 880 undervalued stocks based on cash flows that align with cash flow based pricing checks.
- Ride powerful technology themes by scanning these 25 AI penny stocks shaping how artificial intelligence filters into everyday businesses.
- Boost your focus on income by reviewing these 14 dividend stocks with yields > 3% that already offer yields above 3%.
This article by Simply Wall St is general in nature. We provide commentary based on historical data and analyst forecasts only using an unbiased methodology and our articles are not intended to be financial advice. It does not constitute a recommendation to buy or sell any stock, and does not take account of your objectives, or your financial situation. We aim to bring you long-term focused analysis driven by fundamental data. Note that our analysis may not factor in the latest price-sensitive company announcements or qualitative material. Simply Wall St has no position in any stocks mentioned.
Have feedback on this article? Concerned about the content? Get in touch with us directly. Alternatively, email editorial-team@simplywallst.com