
Is Northrop Grumman (NOC) Pricing Reflect Recent Gains Or Overstated Growth Expectations
- If you are wondering whether Northrop Grumman’s current share price reflects its underlying value, you are not alone. This article will walk through what the numbers are saying about the stock.
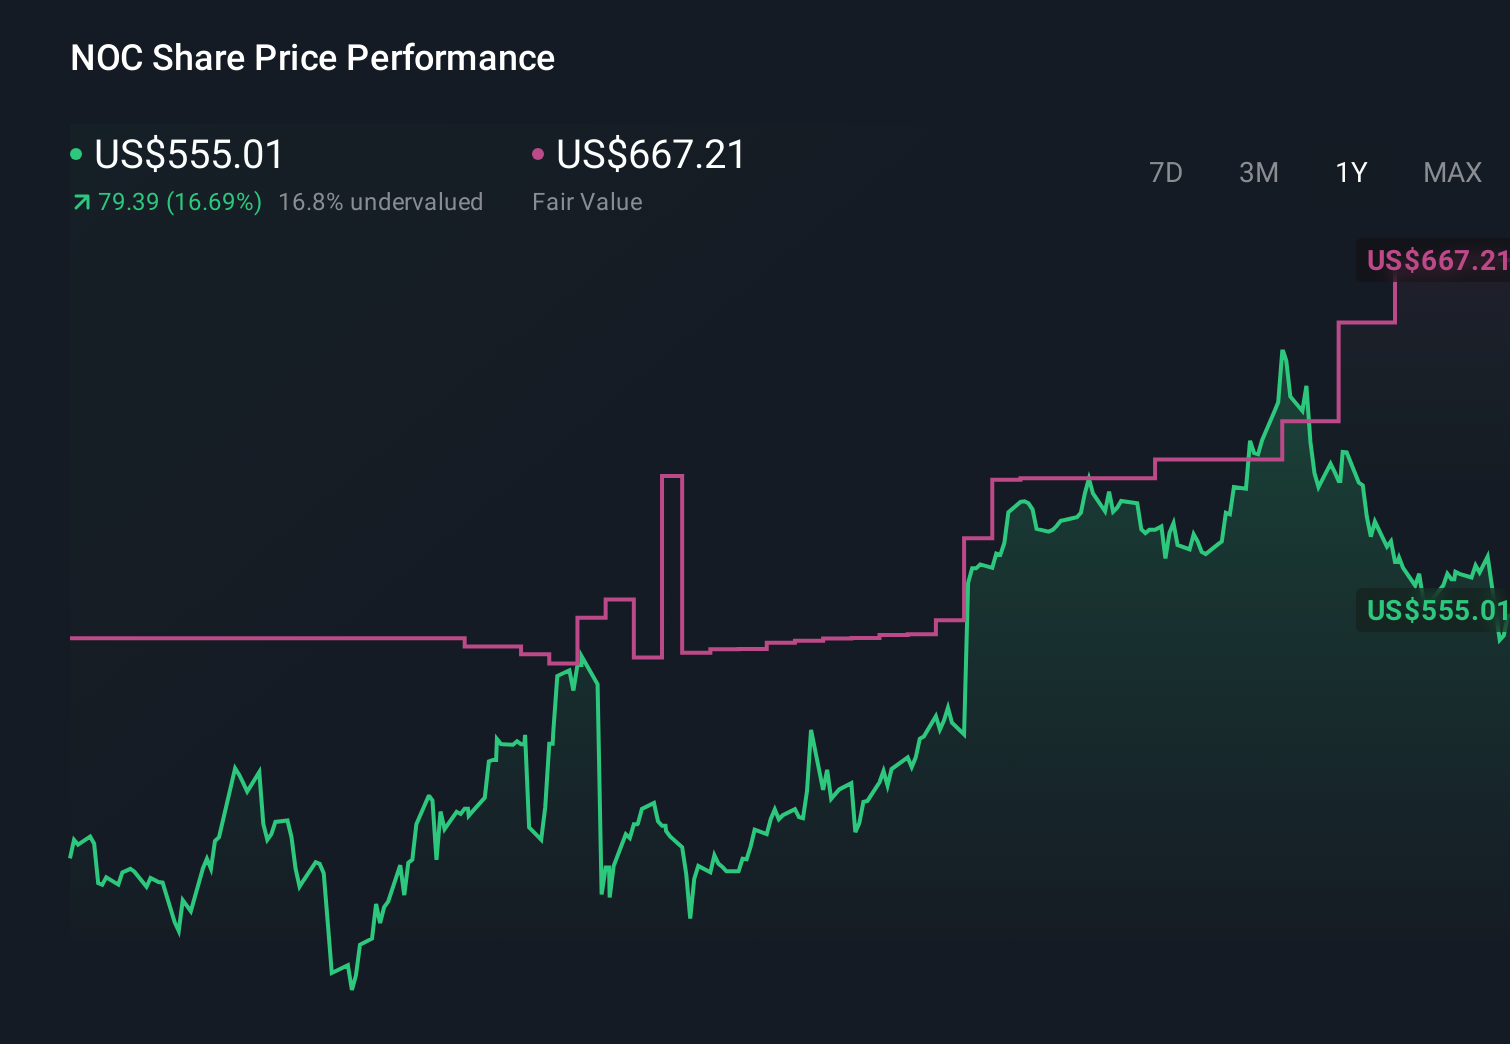
- With the share price at US$577.01, the stock has returned 1.2% over the last 7 days, 4.2% over the last 30 days, and 27.0% over the last year, while the year to date return is a 1.5% decline.
- These moves sit against a backdrop where Northrop Grumman continues to be closely watched as a major US defense contractor, with investors paying attention to contract activity, order backlog and the sector’s role in government spending. Together, these factors help frame how the market may be thinking about the balance between opportunity and risk around the stock.
- Our valuation checks give Northrop Grumman a 3/6 valuation score. We will unpack this using several common approaches, then finish by looking at a more complete way to think about what the stock could be worth.
Find out why Northrop Grumman's 27.0% return over the last year is lagging behind its peers.
Approach 1: Northrop Grumman Discounted Cash Flow (DCF) Analysis
A Discounted Cash Flow, or DCF, model takes projected future cash flows and discounts them back to what they might be worth today, using the idea that cash received in the future is worth less than cash in hand now.
For Northrop Grumman, the model used is a 2 Stage Free Cash Flow to Equity approach, built on last twelve month free cash flow of about $1.75b. Analyst inputs cover the earlier years, and Simply Wall St then extends those projections further out. For example, projected free cash flow reaches $3.86b in 2029, with intermediate estimates between 2026 and 2035 ranging from about $3.33b to $4.61b before discounting.
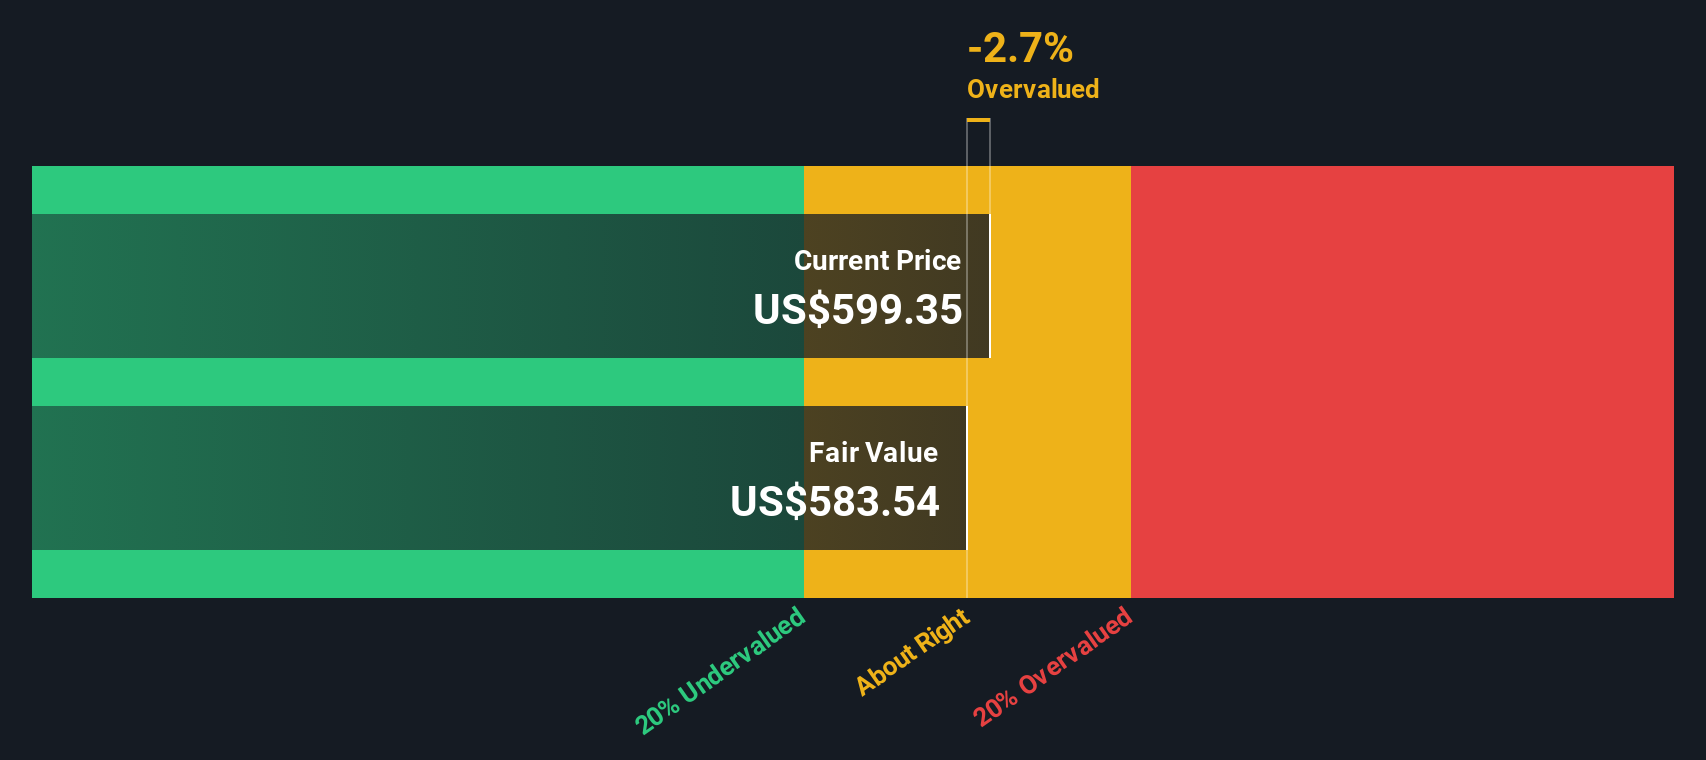
When those future cash flows are discounted back and aggregated, the model points to an estimated intrinsic value of about $508.77 per share. Compared with the recent share price of US$577.01, this implies the stock is around 13.4% overvalued on this DCF view.
Result: OVERVALUED
Our Discounted Cash Flow (DCF) analysis suggests Northrop Grumman may be overvalued by 13.4%. Discover 885 undervalued stocks or create your own screener to find better value opportunities.
Approach 2: Northrop Grumman Price vs Earnings
For a profitable company like Northrop Grumman, the P/E ratio is a useful way to think about what you are paying for each dollar of earnings. It links the share price directly to current earnings, which many investors use as a reference point when sizing up value.
What counts as a “normal” or “fair” P/E ratio depends a lot on expectations for future earnings growth and the level of perceived risk. Higher expected growth or lower perceived risk can support a higher P/E, while slower expected growth or higher risk usually point to a lower P/E being more reasonable.
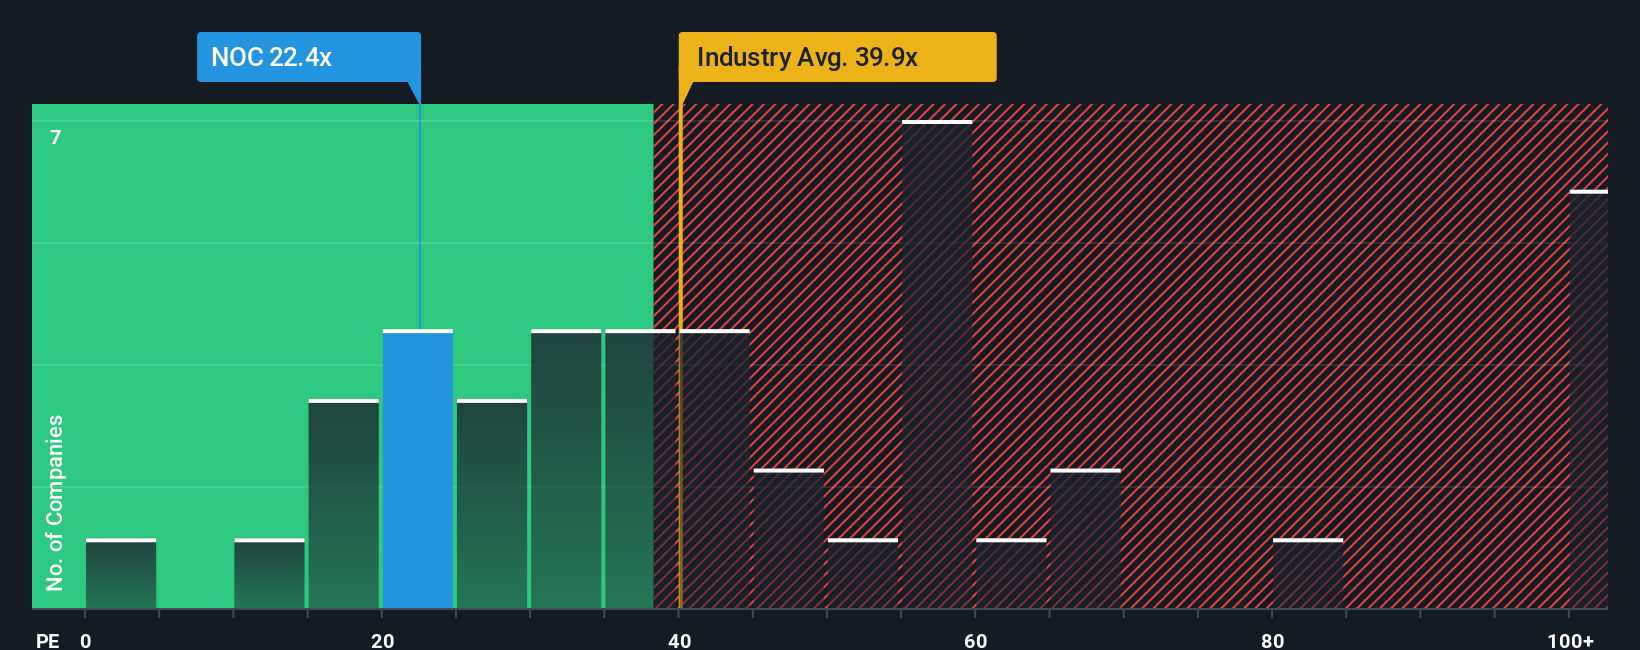
Northrop Grumman trades on a P/E of 20.49x, compared with an Aerospace & Defense industry average of 40.43x and a peer average of 37.47x. Simply Wall St’s Fair Ratio for the stock is 27.72x. The Fair Ratio is a proprietary estimate of what the P/E might be, given factors such as earnings growth, industry, profit margins, market cap and risk. It can be more informative than a simple comparison to peers or the broad industry because it attempts to adjust for those company specific characteristics.
With the current P/E of 20.49x sitting below the Fair Ratio of 27.72x, this approach points to the stock looking undervalued on an earnings multiple basis.
Result: UNDERVALUED
P/E ratios tell one story, but what if the real opportunity lies elsewhere? Discover 1449 companies where insiders are betting big on explosive growth.
Upgrade Your Decision Making: Choose your Northrop Grumman Narrative
Earlier we mentioned that there is an even better way to think about valuation. Let us introduce Narratives, which are simple stories you build around a company that connect your view on its future revenue, earnings and margins to a financial forecast and an assumed fair value. You can then compare that fair value to today’s price to help you decide whether to buy, hold, or sell. All of this happens within an easy tool on Simply Wall St’s Community page that updates automatically when new information such as earnings or news arrives. One investor might create a Northrop Grumman Narrative built around the higher analyst price target of US$690.00 with stronger long term assumptions, while another might anchor on the lower target of US$510.00 with more cautious expectations. Both can clearly see how their story translates into numbers and where they differ.
Do you think there's more to the story for Northrop Grumman? Head over to our Community to see what others are saying!
This article by Simply Wall St is general in nature. We provide commentary based on historical data and analyst forecasts only using an unbiased methodology and our articles are not intended to be financial advice. It does not constitute a recommendation to buy or sell any stock, and does not take account of your objectives, or your financial situation. We aim to bring you long-term focused analysis driven by fundamental data. Note that our analysis may not factor in the latest price-sensitive company announcements or qualitative material. Simply Wall St has no position in any stocks mentioned.
Have feedback on this article? Concerned about the content? Get in touch with us directly. Alternatively, email editorial-team@simplywallst.com