
A Look At ServiceNow (NOW) Valuation After Recent Share Price Weakness
Context for ServiceNow stock today
ServiceNow (NOW) has drawn attention after recent share price swings, with the stock posting a 1.4% move over the past day, a negative week, and deeper declines over the past month and past 3 months.
See our latest analysis for ServiceNow.
Zooming out, ServiceNow’s recent weakness, with a 30 day share price return of an 11.6% decline and a 90 day share price return of a 17.8% decline, contrasts with a modest 2.3% year to date share price gain and a mixed picture on longer term total shareholder returns. This suggests momentum has been fading even as the broader story remains more balanced over several years.
If you are comparing ServiceNow with other software names, it could be a good moment to scan for high growth tech and AI stocks as potential alternatives or complements in your research list.
With ServiceNow trading at US$150.90, annual revenue of US$12.67b and net income of US$1.73b, plus a quoted intrinsic discount, investors may ask whether this weakness is a genuine opportunity or if the market is already pricing in future growth.
Most Popular Narrative: 33.2% Undervalued
Using a fair value of about US$225.84 against ServiceNow’s last close of US$150.90, the most followed narrative frames the current price as a sizeable discount, built on detailed assumptions for growth, margins and required return.
The analysts have a consensus price target of $1142.588 for ServiceNow based on their expectations of its future earnings growth, profit margins and other risk factors. However, there is a degree of disagreement amongst analysts, with the most bullish reporting a price target of $1300.0, and the most bearish reporting a price target of just $734.0.
Curious what sits behind that step down in fair value and still leaves room for upside? Revenue expansion, margin shifts and a premium future earnings multiple all play a part. Want to see how those moving pieces work together over the next few years? The full narrative sets out the earnings path, the assumed profitability range and the valuation multiple required to support that fair value.
Result: Fair Value of $225.84 (UNDERVALUED)
Have a read of the narrative in full and understand what's behind the forecasts.
However, this upside narrative could be challenged if large acquisitions strain margins or if reliance on U.S. federal contracts exposes earnings to budget cuts.
Find out about the key risks to this ServiceNow narrative.
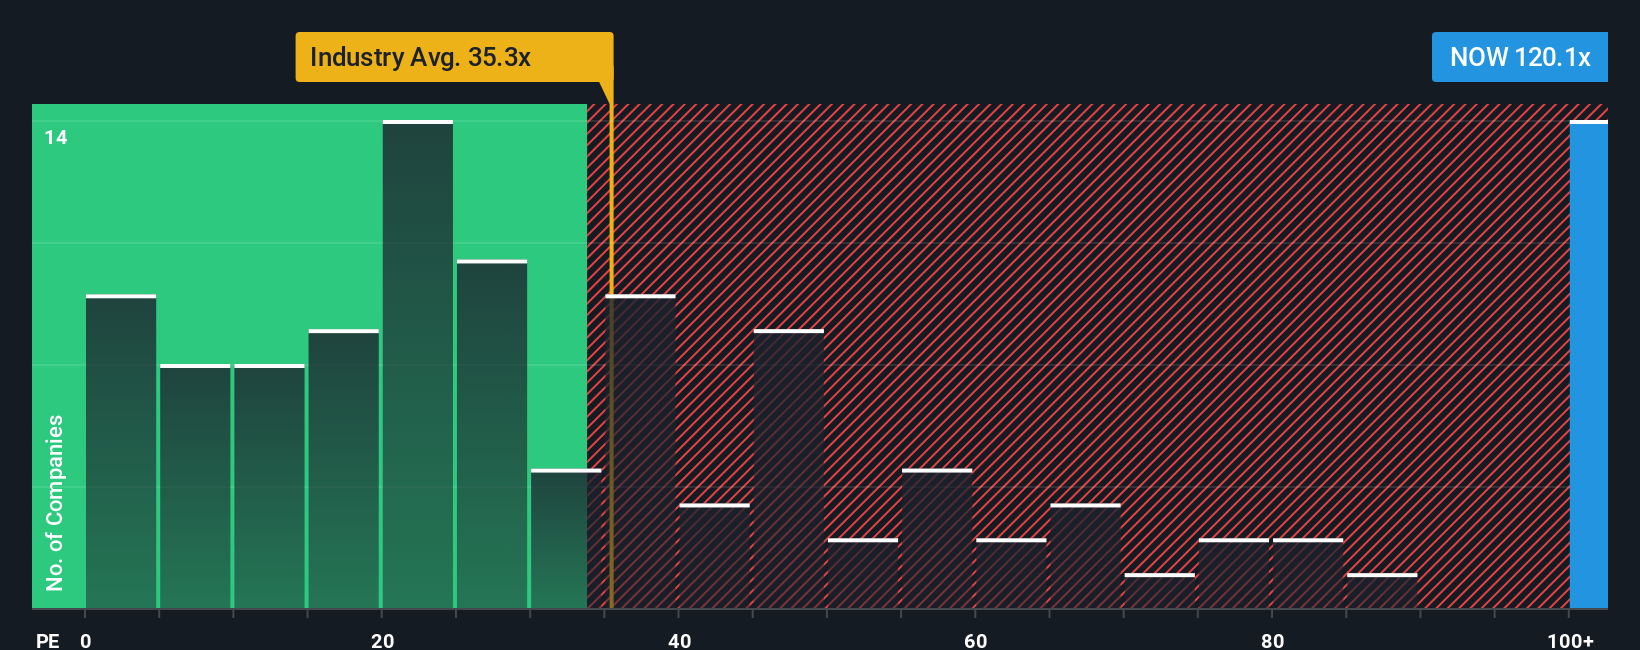
Another View: Valuation Tension From P/E Ratios
Here is the catch. While the narrative and fair value work up suggest ServiceNow is undervalued, its current P/E of 90.4x is far higher than the US Software industry at 32.7x, the peer average at 52.2x and even our fair ratio of 43.7x. This points to meaningful valuation risk if sentiment cools. How comfortable are you paying more than double that fair ratio?
See what the numbers say about this price — find out in our valuation breakdown.
Build Your Own ServiceNow Narrative
If this setup does not quite fit how you see ServiceNow, you can stress test the assumptions yourself and build a tailored view in minutes with Do it your way.
A good starting point is our analysis highlighting 4 key rewards investors are optimistic about regarding ServiceNow.
Looking for more investment ideas?
If ServiceNow is on your radar, do not stop there. A wider watchlist can help you spot opportunities earlier, compare quality, and keep your options open.
- Target potential income by scanning these 12 dividend stocks with yields > 3% that may suit investors who want regular cash returns alongside share price moves.
- Chase growth themes by researching these 26 AI penny stocks that are tied to the rollout of artificial intelligence across different parts of the economy.
- Hunt for mispriced opportunities using these 886 undervalued stocks based on cash flows that could offer more attractive entry points than widely followed large caps.
This article by Simply Wall St is general in nature. We provide commentary based on historical data and analyst forecasts only using an unbiased methodology and our articles are not intended to be financial advice. It does not constitute a recommendation to buy or sell any stock, and does not take account of your objectives, or your financial situation. We aim to bring you long-term focused analysis driven by fundamental data. Note that our analysis may not factor in the latest price-sensitive company announcements or qualitative material. Simply Wall St has no position in any stocks mentioned.
Have feedback on this article? Concerned about the content? Get in touch with us directly. Alternatively, email editorial-team@simplywallst.com