
Is Smurfit Westrock (SW) Pricing Look Interesting After Recent Share Price Weakness?
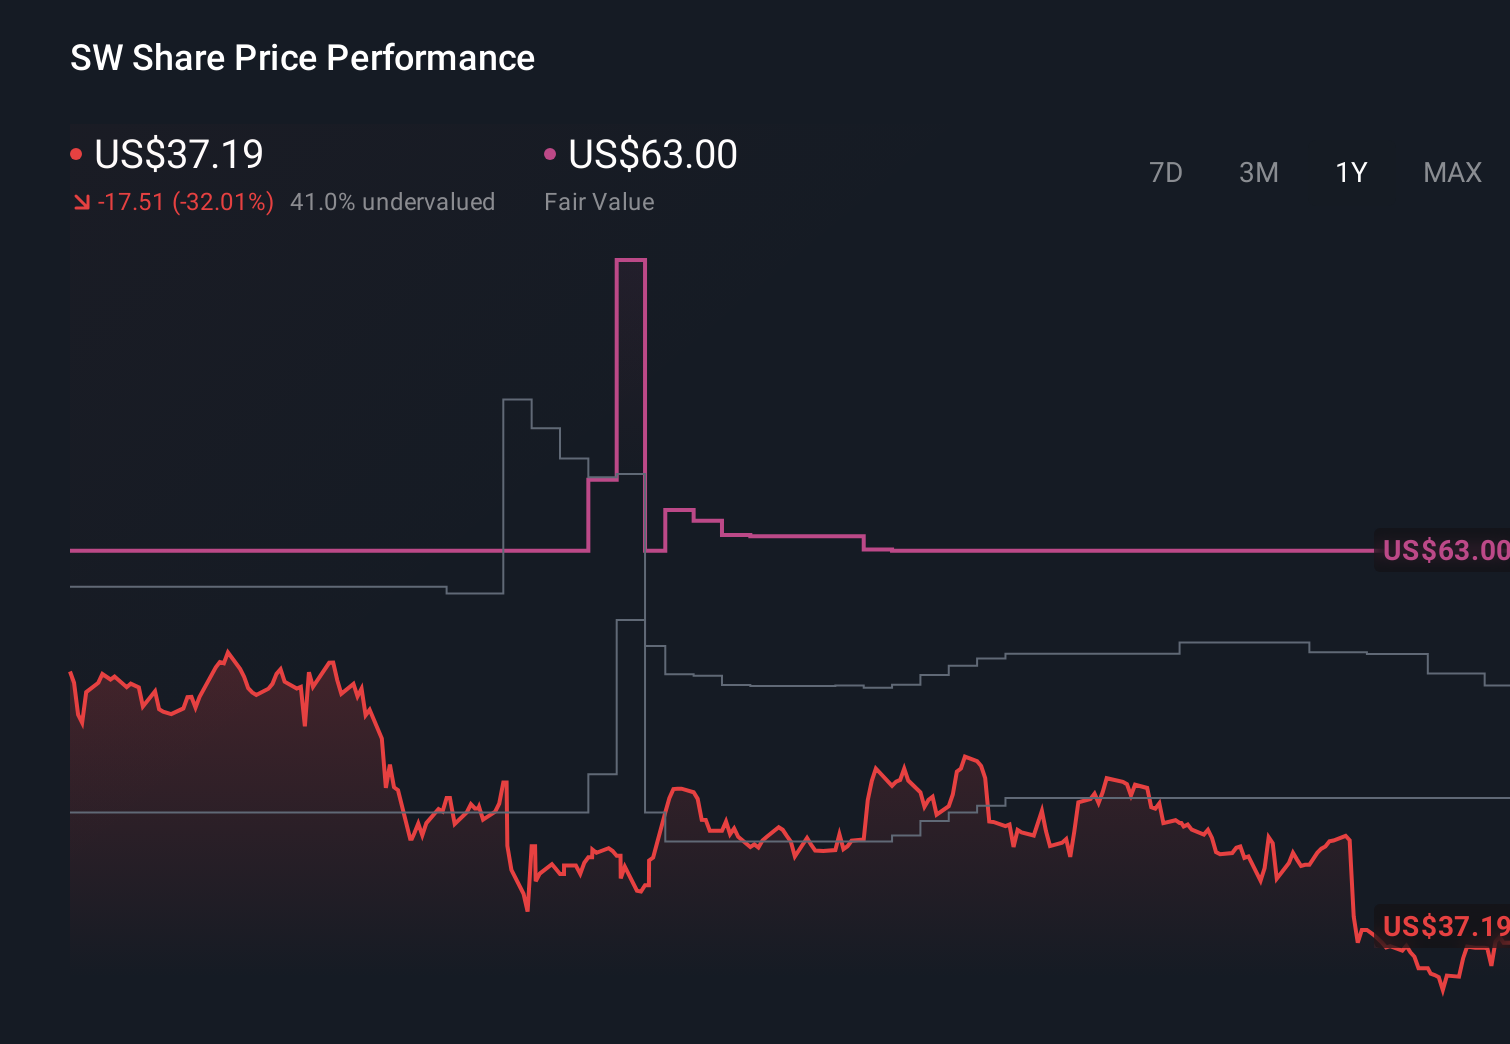
- If you are wondering whether Smurfit Westrock, at a last close of US$39.64, is a bargain or just fairly priced, you are in the right place.
- The stock has seen mixed returns, with gains of 2.5% over the last 7 days and 9.9% over 30 days, but only 0.1% year to date and a 20.6% decline over 1 year, while the 3 year and 5 year returns sit at 9.8% and 0.3% respectively.
- Recent news flow has kept attention on Smurfit Westrock as investors consider what these return figures might indicate for expectations and risk. This context matters because it frames how the market is currently treating the stock relative to its fundamentals.
- On our checks, Smurfit Westrock scores 4/6 on valuation, as shown in the valuation scorecard. Next we will walk through what different valuation approaches say about that score, before finishing with a more complete way to judge whether the current price really stacks up.
Find out why Smurfit Westrock's -20.6% return over the last year is lagging behind its peers.
Approach 1: Smurfit Westrock Discounted Cash Flow (DCF) Analysis
A Discounted Cash Flow, or DCF, model estimates what a company might be worth by projecting its future cash flows and then discounting those back to today’s value using a required rate of return.
For Smurfit Westrock, the model used is a 2 Stage Free Cash Flow to Equity approach that starts from last twelve months free cash flow of about US$780.7 million. Analysts provide explicit forecasts up to 2029, with free cash flow projections such as US$1,917.8 million for 2026 and US$3,688 million for 2029. Beyond that, Simply Wall St extrapolates cash flows out to 2035, which reach around US$6,409.5 million before discounting, with all figures in US$.
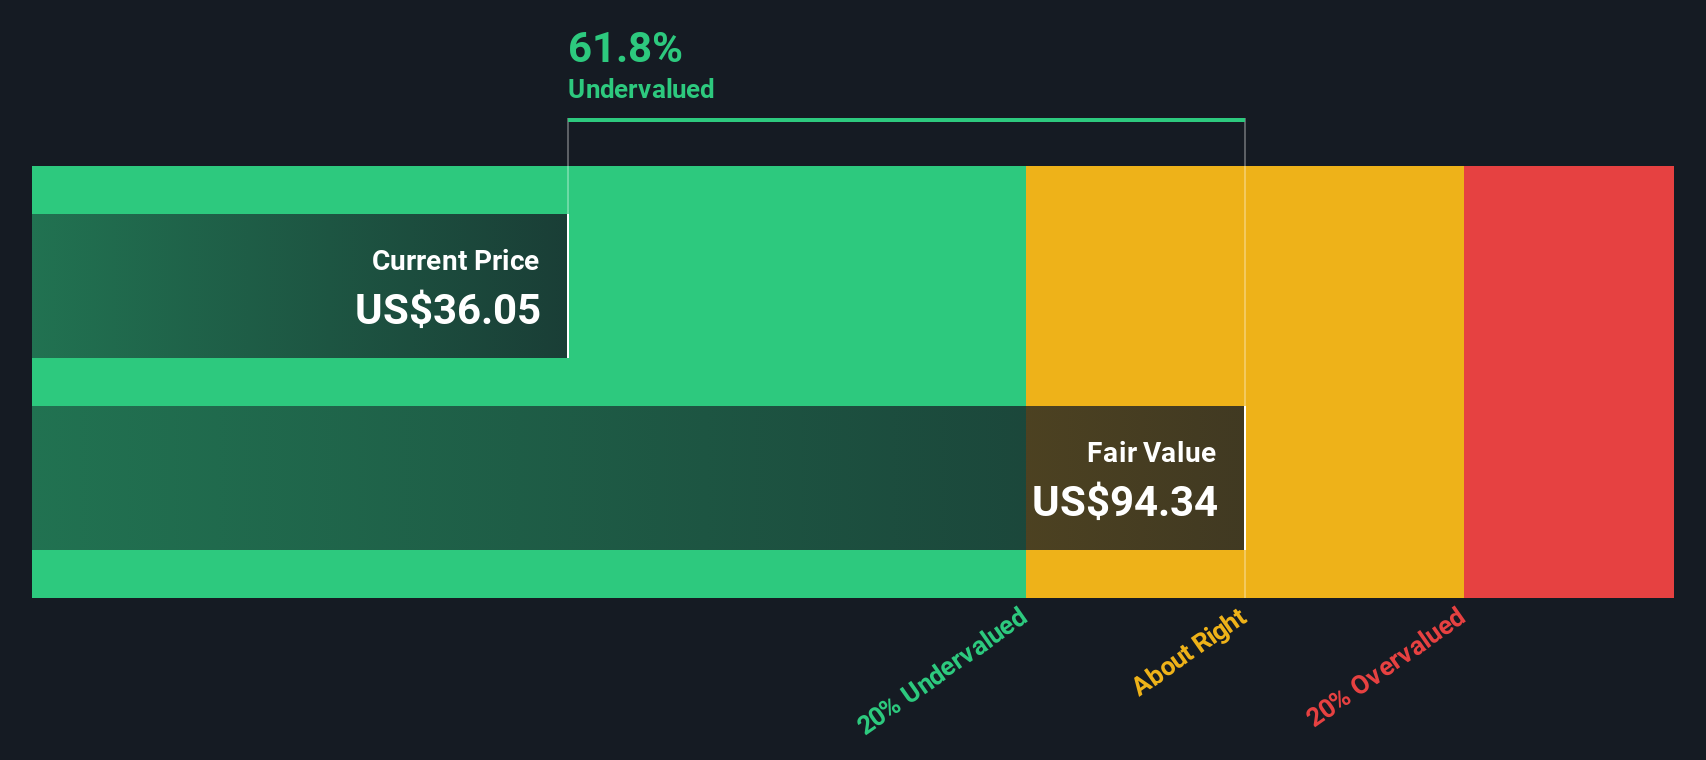
Using these projected cash flows, the DCF model arrives at an estimated intrinsic value of US$163.35 per share. Compared with the recent share price of US$39.64, this implies the stock is 75.7% undervalued based on this method.
Result: UNDERVALUED
Our Discounted Cash Flow (DCF) analysis suggests Smurfit Westrock is undervalued by 75.7%. Track this in your watchlist or portfolio, or discover 884 more undervalued stocks based on cash flows.
Approach 2: Smurfit Westrock Price vs Earnings
For a profitable company like Smurfit Westrock, the P/E ratio is a useful way to think about valuation because it links what you pay today to the earnings the business is currently generating. In broad terms, higher expected growth and lower perceived risk tend to justify a higher P/E, while slower expected growth or higher risk usually go with a lower, more cautious P/E.
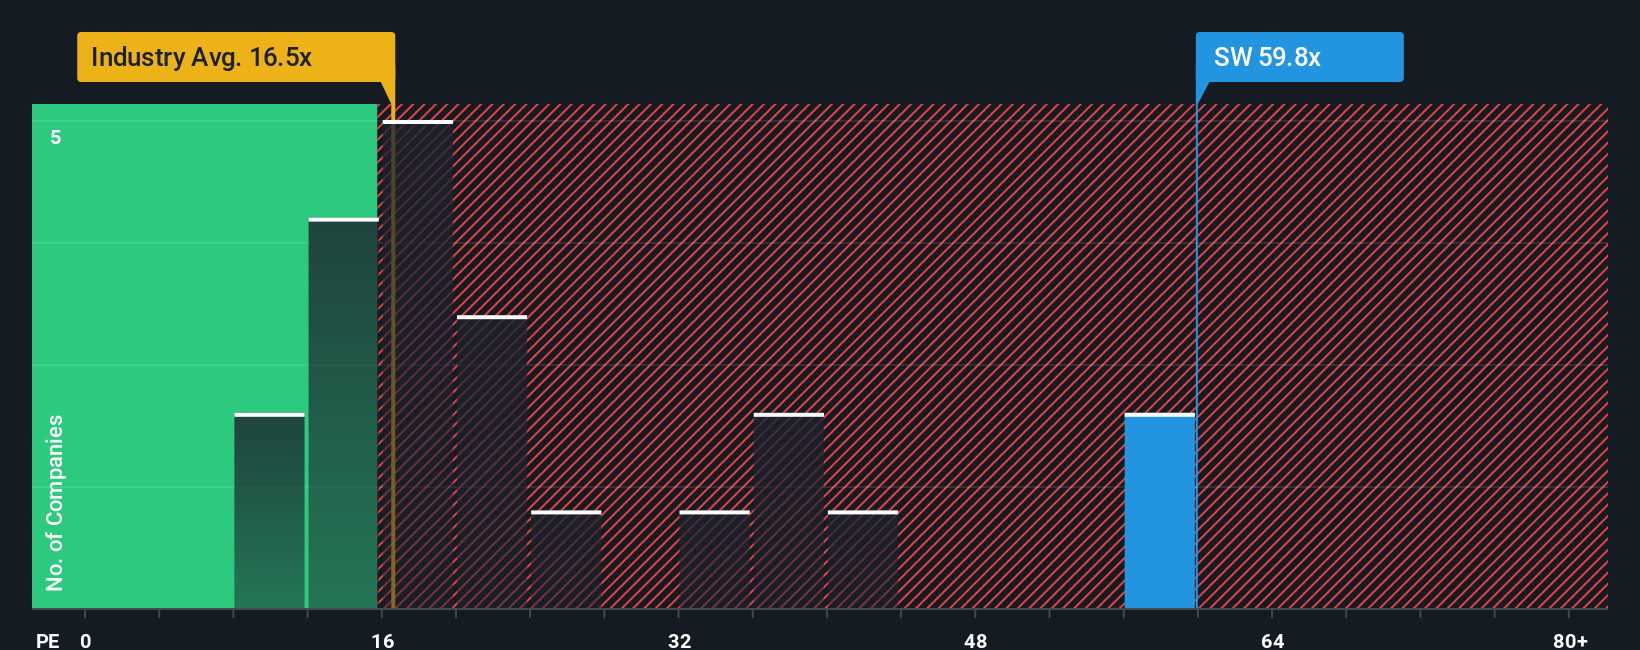
Smurfit Westrock currently trades on a P/E of 27.60x. That sits above the Packaging industry average of 15.61x and also above its peer group average of 22.40x, so the market is currently assigning it a higher earnings multiple than these simple benchmarks.
Simply Wall St’s Fair Ratio for Smurfit Westrock is 28.86x. This is a proprietary P/E level that reflects factors such as the company’s earnings growth profile, its industry, profit margins, market cap and specific risks. Because it incorporates these company specific inputs, the Fair Ratio can be a more tailored yardstick than a basic comparison with industry or peer averages alone.
Set against that Fair Ratio, Smurfit Westrock’s actual P/E of 27.60x is slightly lower, which indicates that the shares may be modestly undervalued on this earnings based view.
Result: UNDERVALUED
P/E ratios tell one story, but what if the real opportunity lies elsewhere? Discover 1443 companies where insiders are betting big on explosive growth.
Upgrade Your Decision Making: Choose your Smurfit Westrock Narrative
Earlier we mentioned that there is an even better way to understand valuation, so let us introduce you to Narratives, which are simple, user created stories that tie your view of Smurfit Westrock’s future revenues, earnings and margins to a forecast and then to a Fair Value that you can compare to today’s price, all within Simply Wall St’s Community page that is used by millions of investors.
Do you think there's more to the story for Smurfit Westrock? Head over to our Community to see what others are saying!
This article by Simply Wall St is general in nature. We provide commentary based on historical data and analyst forecasts only using an unbiased methodology and our articles are not intended to be financial advice. It does not constitute a recommendation to buy or sell any stock, and does not take account of your objectives, or your financial situation. We aim to bring you long-term focused analysis driven by fundamental data. Note that our analysis may not factor in the latest price-sensitive company announcements or qualitative material. Simply Wall St has no position in any stocks mentioned.
Have feedback on this article? Concerned about the content? Get in touch with us directly. Alternatively, email editorial-team@simplywallst.com