
Is Walmart (WMT) Still Attractive After Recent Retail Strength And Rich P/E Ratio?
- If you have ever wondered whether Walmart's share price still offers value after a long run in the market, this article will walk you through what the current numbers might mean for you.
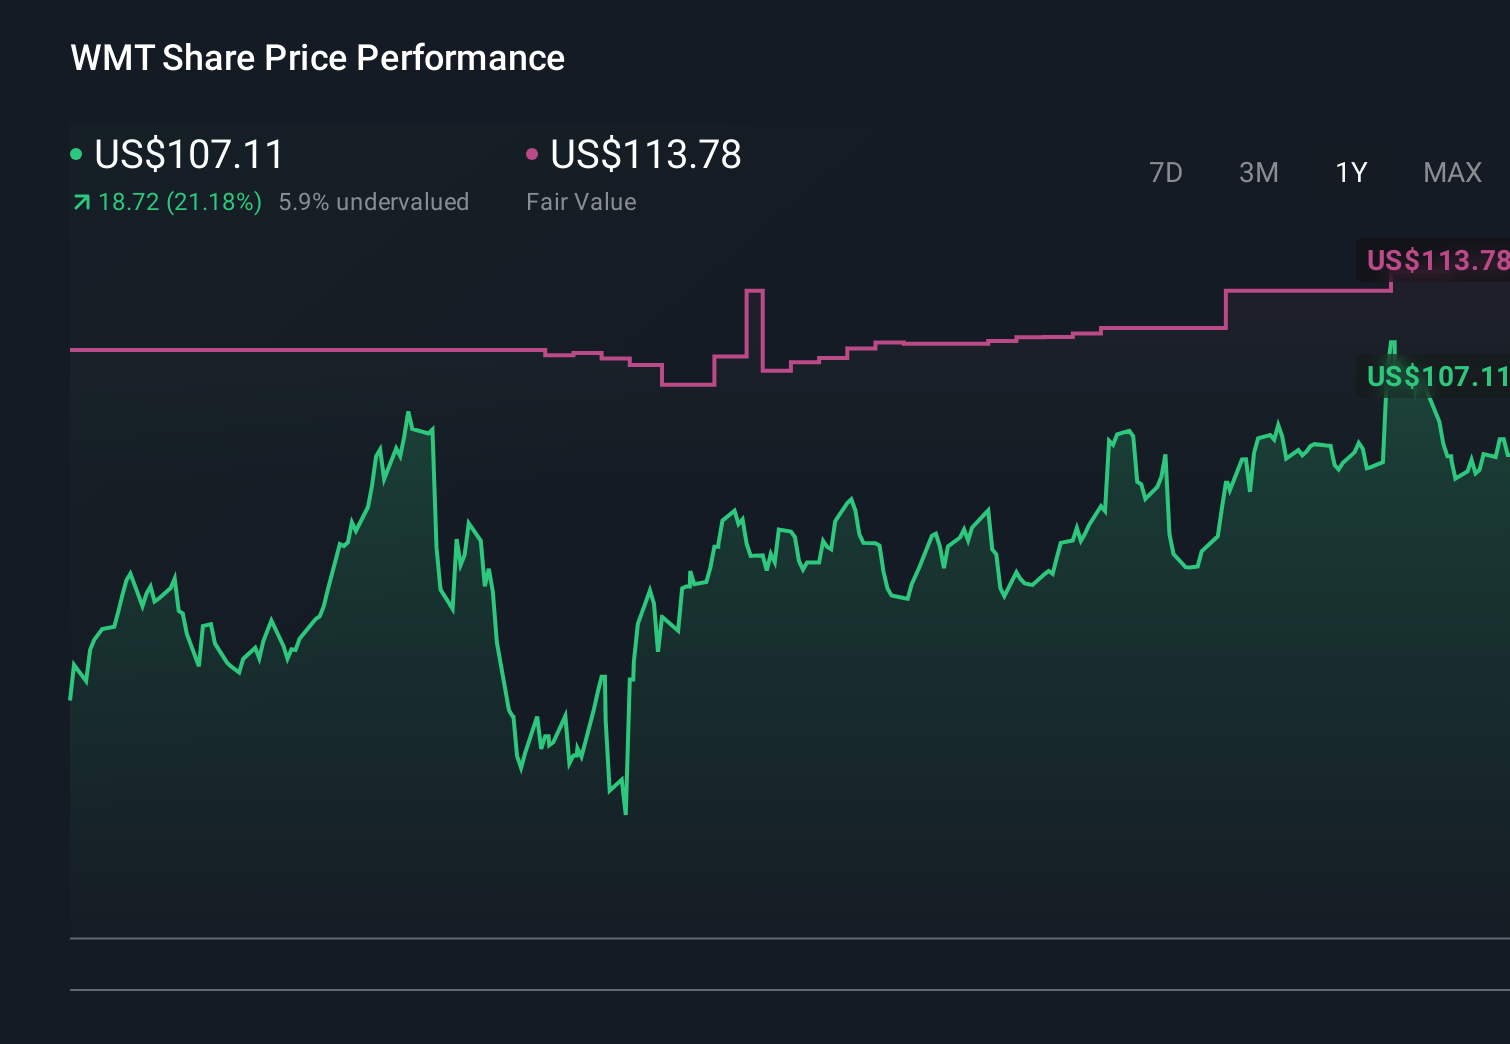
- Walmart's stock recently closed at US$112.72, with returns of 1.2% over the last 7 days, a 0.7% decline over 30 days, around flat year to date, 24.0% over 1 year, 140.0% over 3 years, and 145.5% over 5 years.
- Recent news around Walmart has focused on its role as a major US retailer and its scale in everyday consumer spending. This helps frame how investors may be thinking about its long term position in the market and can influence how the recent share price moves are interpreted by investors looking at both potential growth and risks.
- Simply Wall St currently assigns Walmart a value score of 1 out of 6, based on how many checks suggest the stock is undervalued. Next, we will look at the usual valuation approaches you are likely familiar with, before finishing with a different way of thinking about value that some investors may find more useful.
Walmart scores just 1/6 on our valuation checks. See what other red flags we found in the full valuation breakdown.
Approach 1: Walmart Discounted Cash Flow (DCF) Analysis
A Discounted Cash Flow model takes the cash Walmart is expected to generate in the future and then discounts those projections back to what they might be worth in today’s dollars.
For Walmart, the latest twelve month free cash flow is about $17.3b. Using a 2 Stage Free Cash Flow to Equity model, analysts and Simply Wall St project free cash flow out to 2035, with analyst inputs used up to 2030 and then extrapolated. For example, projected free cash flow for 2030 is $33.4b, with a discounted value of $23.8b. Discounted values for years such as 2026 and 2029 are $13.7b and $19.4b respectively, reflecting the effect of bringing those future cash flows back to today.
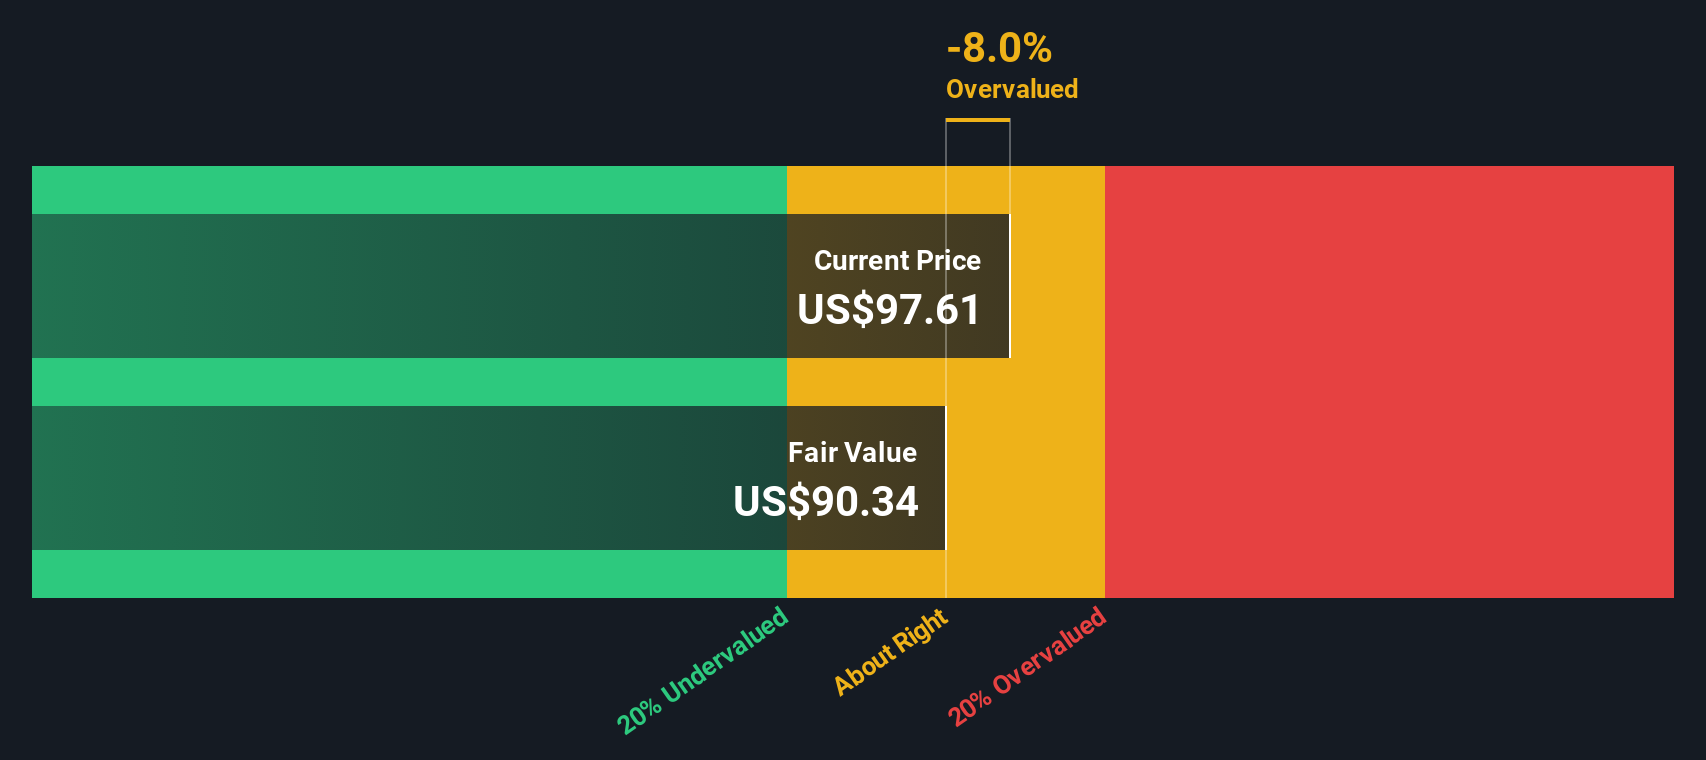
When all discounted cash flows are added together, the model estimates an intrinsic value of US$126.90 per share, compared with the recent share price of US$112.72. That implies Walmart trades at about an 11.2% discount to this DCF estimate, which points to the shares being undervalued on this cash flow view.
Result: UNDERVALUED
Our Discounted Cash Flow (DCF) analysis suggests Walmart is undervalued by 11.2%. Track this in your watchlist or portfolio, or discover 884 more undervalued stocks based on cash flows.
Approach 2: Walmart Price vs Earnings
For a profitable company like Walmart, the P/E ratio is a useful way to think about what you are paying for each dollar of earnings. In simple terms, higher expected growth and lower perceived risk usually support a higher "normal" or "fair" P/E, while slower expected growth or higher risk often point to a lower one.
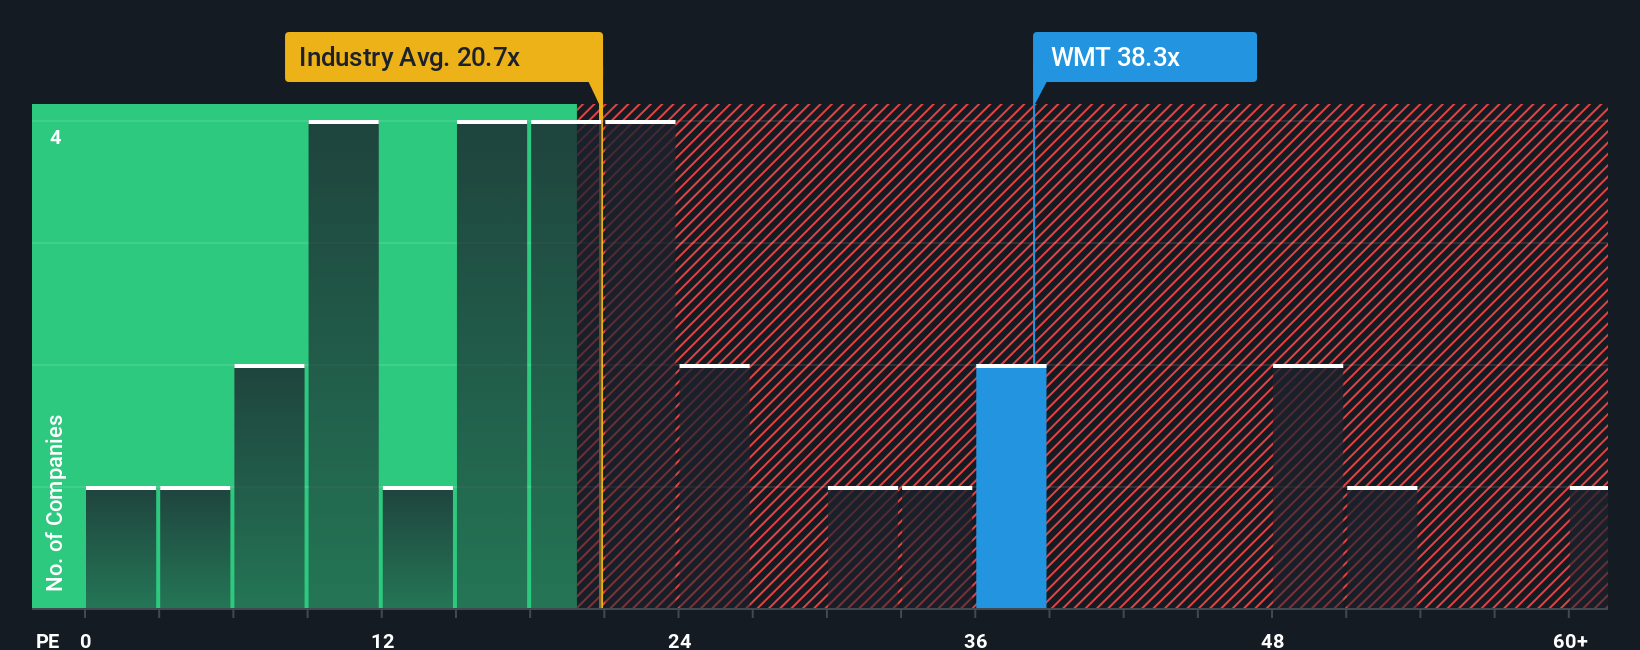
Walmart currently trades on a P/E of 39.21x. That is above the Consumer Retailing industry average P/E of 23.49x and also above the peer group average of 26.97x. At first glance, that indicates investors are paying a higher price for Walmart's earnings than for many of its sector peers.
Simply Wall St also calculates a proprietary "Fair Ratio" for Walmart of 38.41x. This is the P/E level that might be expected given factors such as its earnings growth profile, industry, profit margins, market capitalization and specific risks. Because it blends these company specific inputs, the Fair Ratio can be more informative than a simple comparison with peers or the broad industry, which may not share the same mix of growth, risk and profitability.
Comparing the actual P/E of 39.21x with the Fair Ratio of 38.41x shows Walmart is slightly above this tailored benchmark, which indicates the shares are overvalued on this metric.
Result: OVERVALUED
P/E ratios tell one story, but what if the real opportunity lies elsewhere? Discover 1443 companies where insiders are betting big on explosive growth.
Upgrade Your Decision Making: Choose your Walmart Narrative
Earlier we mentioned that there is an even better way to think about value, and on Simply Wall St that starts with Narratives. This is where you set out your story for Walmart, link it to explicit forecasts for revenue, earnings and margins, translate that into a fair value, and then see it live on the Community page. There you can compare that fair value with the current share price, react as new news or earnings update the numbers, and even see how different investors can look at the same company very differently. For example, one Narrative treats Walmart as a long term omni channel and AI commerce winner that supports a fair value around US$121.38, while another more cautious view focuses on cost pressures, wage inflation and capital needs and lands closer to the lower analyst target of US$64.00.
Do you think there's more to the story for Walmart? Head over to our Community to see what others are saying!
This article by Simply Wall St is general in nature. We provide commentary based on historical data and analyst forecasts only using an unbiased methodology and our articles are not intended to be financial advice. It does not constitute a recommendation to buy or sell any stock, and does not take account of your objectives, or your financial situation. We aim to bring you long-term focused analysis driven by fundamental data. Note that our analysis may not factor in the latest price-sensitive company announcements or qualitative material. Simply Wall St has no position in any stocks mentioned.
Have feedback on this article? Concerned about the content? Get in touch with us directly. Alternatively, email editorial-team@simplywallst.com