
Is Western Union (WU) Being Priced Too Cautiously Given Its Recent Valuation Signals
- If you are wondering whether Western Union is a bargain or a value trap at its current share price, this article will walk through what the numbers say about the stock.
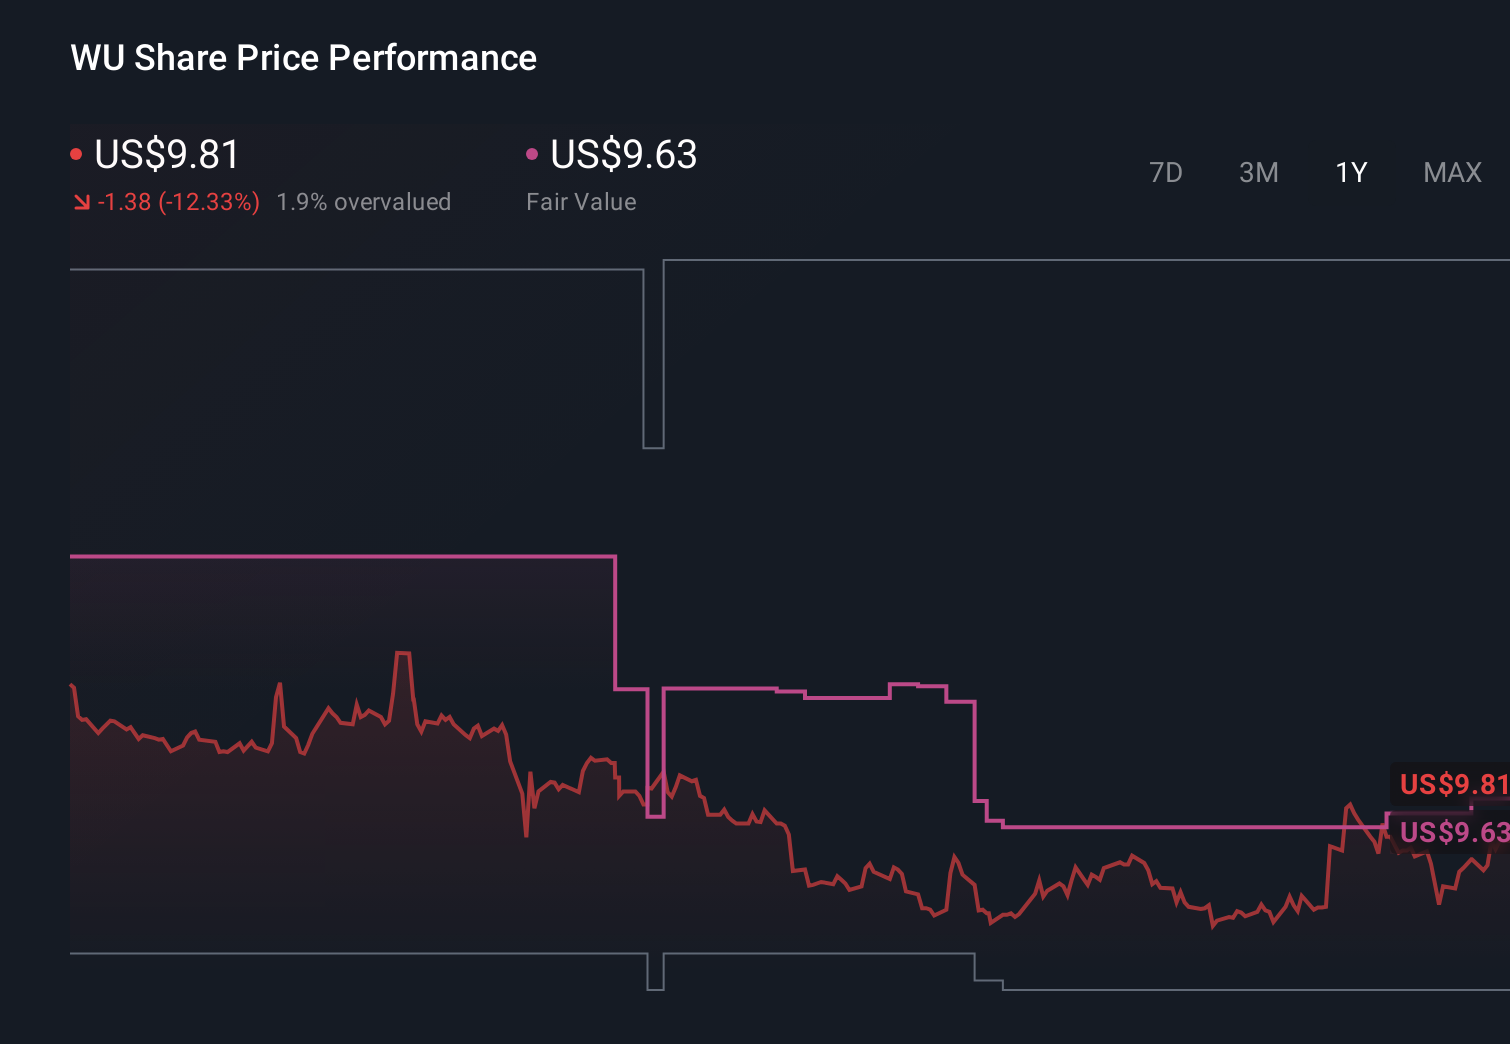
- Over recent periods the share price has shown mixed returns, with 3.1% over the last 7 days, 6.2% over 30 days, 4.0% year to date, 1.9% over 1 year, and declines of 15.1% and 38.1% across the past 3 and 5 years.
- Recent news flow around Western Union has focused on its role in global money transfers and the ongoing relevance of its network in a world with more digital payment options. This context helps frame why shorter term gains may sit alongside weaker multi year returns as investors reassess how they view the business.
- On Simply Wall St’s valuation checks Western Union scores 5 out of 6, giving it a valuation score of 5. Next, we will look at the different valuation approaches behind that score, then finish with a way to tie all of them together more clearly.
Find out why Western Union's 1.9% return over the last year is lagging behind its peers.
Approach 1: Western Union Excess Returns Analysis
The Excess Returns model looks at how much profit a company can earn above the return that equity investors require, then capitalizes those extra profits into an estimated value per share.
For Western Union, the model uses a Book Value of $2.91 per share and a Stable EPS of $1.75 per share, based on weighted future Return on Equity estimates from 6 analysts. The Average Return on Equity is 47.89%, while the Cost of Equity is $0.28 per share. That leaves an Excess Return of $1.47 per share, which is what the model treats as value created beyond investors’ required return.
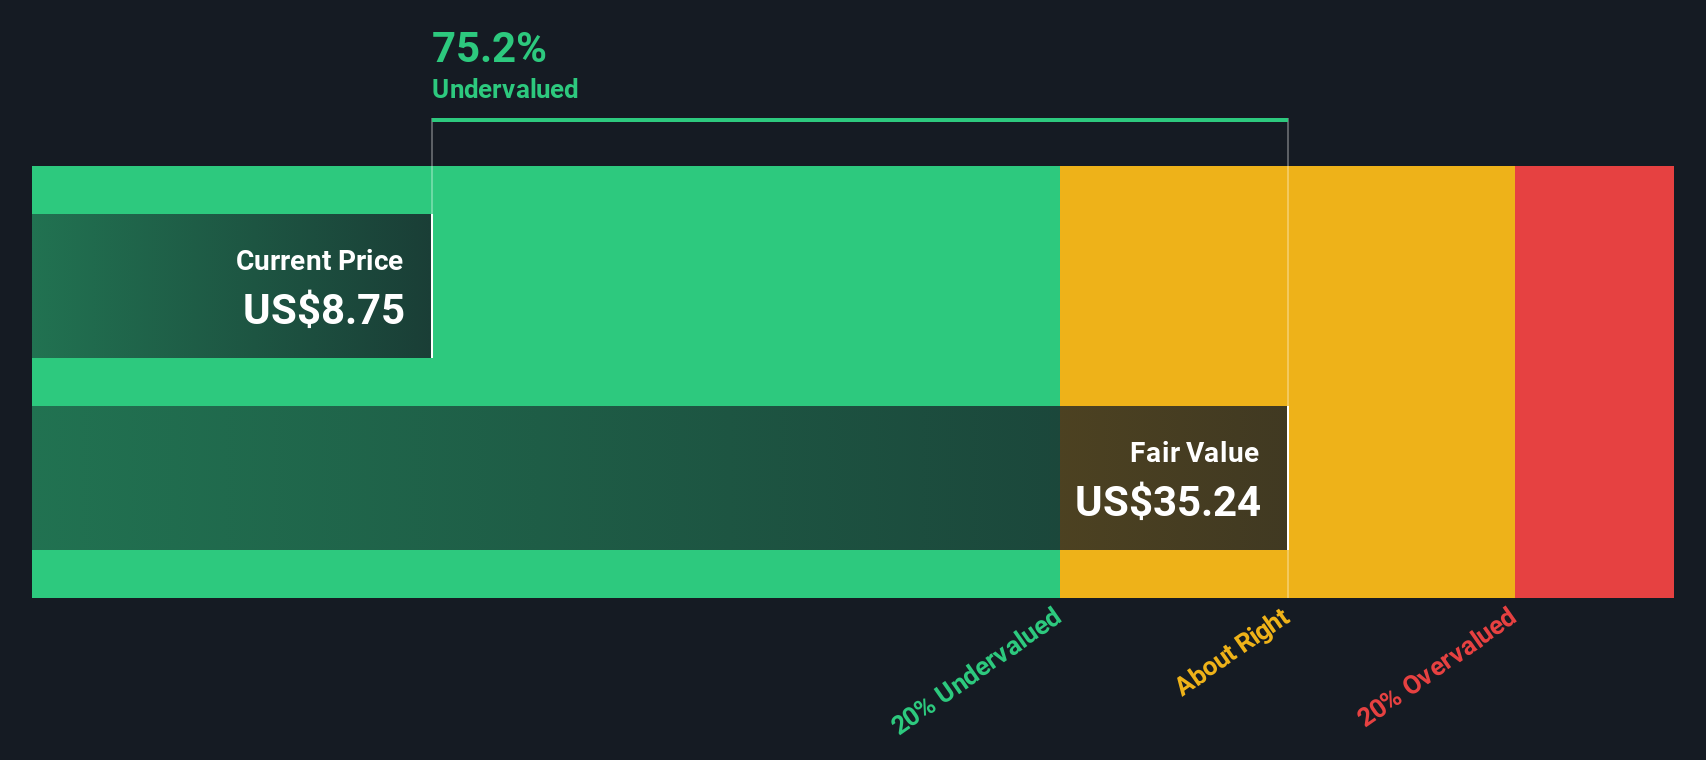
The Stable Book Value is $3.65 per share, sourced from weighted future book value estimates from 4 analysts. Combining this with the excess returns stream gives an intrinsic value estimate of about $37.89 per share. Compared with the current market price, the model implies the shares are 74.7% undervalued, suggesting the market is pricing Western Union well below the value implied by its projected returns on equity.
Result: UNDERVALUED
Our Excess Returns analysis suggests Western Union is undervalued by 74.7%. Track this in your watchlist or portfolio, or discover 884 more undervalued stocks based on cash flows.
Approach 2: Western Union Price vs Earnings
For a consistently profitable company, the P/E ratio is a useful shorthand because it links what you pay for the stock to the earnings the business is already producing. It lets you compare Western Union with other profitable companies using the same common yardstick.
What counts as a normal P/E depends on how fast earnings are expected to grow and how risky those earnings appear. Higher growth and lower perceived risk usually justify a higher P/E, while slower growth or higher uncertainty tend to pull a fair P/E lower.
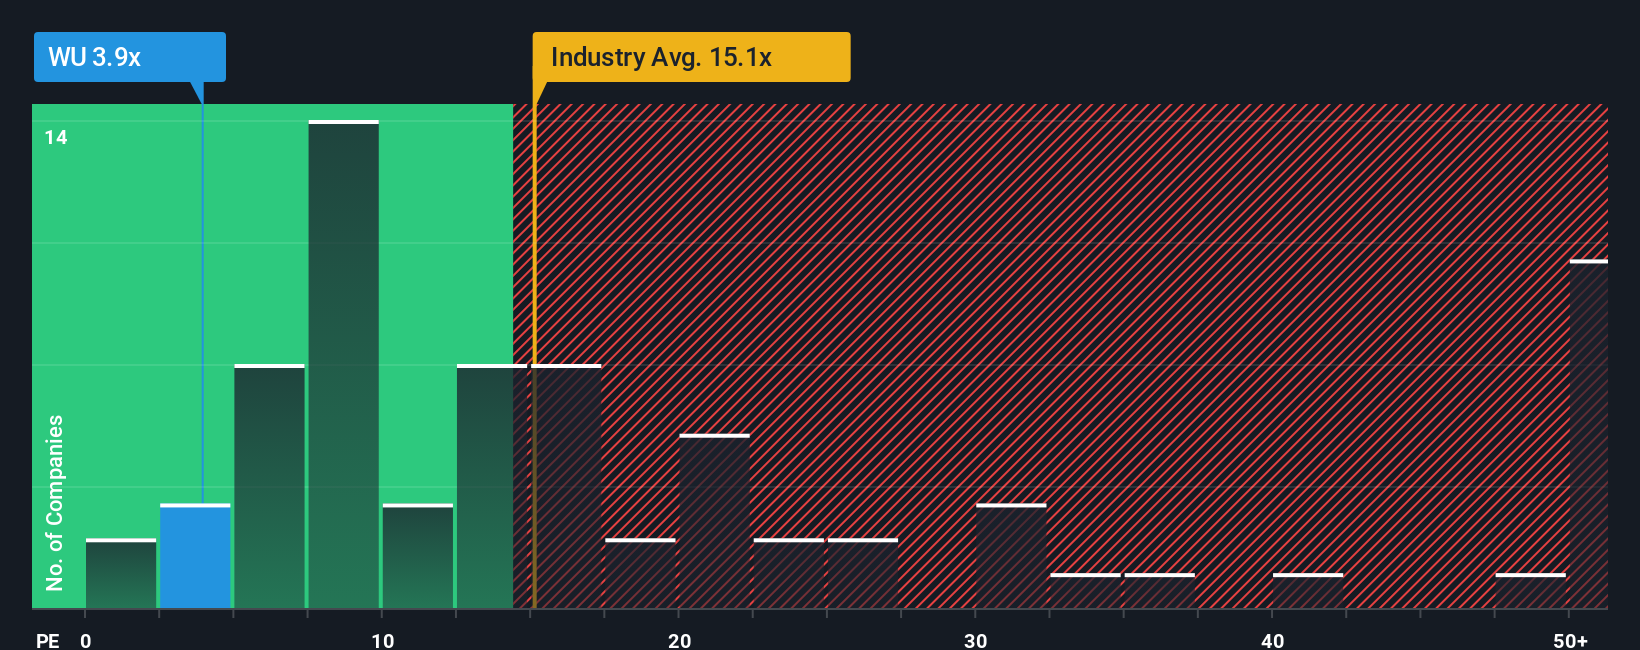
Western Union currently trades on a P/E of 3.96x. That sits well below the Diversified Financial industry average of 14.20x and the peer group average of 14.33x. Simply Wall St’s Fair Ratio for Western Union is 11.91x, which is its own estimate of what a reasonable P/E might be after adjusting for factors such as earnings growth, profit margins, industry, market cap and company specific risks.
This Fair Ratio is more tailored than a simple peer or industry comparison because it adjusts for differences in quality and risk rather than assuming all companies deserve the same multiple. On this basis, Western Union’s current P/E of 3.96x is below its Fair Ratio of 11.91x, which indicates the shares may be undervalued on this metric.
Result: UNDERVALUED
P/E ratios tell one story, but what if the real opportunity lies elsewhere? Discover 1443 companies where insiders are betting big on explosive growth.
Upgrade Your Decision Making: Choose your Western Union Narrative
Earlier we mentioned that there is an even better way to understand valuation. Let us introduce you to Narratives, which are simply your story about Western Union, linked to your own forecast for revenue, earnings and margins. This can then be translated into a fair value that you can compare with today’s price using a tool on Simply Wall St’s Community page that millions of investors already use. Narratives refresh as news or earnings roll in. For example, one Western Union Narrative might lean heavily on digital services, AI and stablecoin initiatives to support a fair value close to US$17.00. Another, more cautious Narrative might focus on regulatory risk, competition and pressure on transaction volumes and margins to arrive nearer US$7.00. This gives you a clear, side by side view of how different assumptions lead to different fair values and helps you decide how the current share price lines up with the story you find most reasonable.
Do you think there's more to the story for Western Union? Head over to our Community to see what others are saying!
This article by Simply Wall St is general in nature. We provide commentary based on historical data and analyst forecasts only using an unbiased methodology and our articles are not intended to be financial advice. It does not constitute a recommendation to buy or sell any stock, and does not take account of your objectives, or your financial situation. We aim to bring you long-term focused analysis driven by fundamental data. Note that our analysis may not factor in the latest price-sensitive company announcements or qualitative material. Simply Wall St has no position in any stocks mentioned.
Have feedback on this article? Concerned about the content? Get in touch with us directly. Alternatively, email editorial-team@simplywallst.com