
Is Adient (ADNT) Offering An Opportunity After Mixed Long Term Share Returns
- If you are wondering whether Adient's current share price reflects its real value, you are not alone. This article is here to unpack what the market might be pricing in.
- Over the last week the stock returned 0.9%, over the last month 3.2%, with a 1.6% return year to date, while the 1 year return of 13.7% contrasts with a 53.1% decline over 3 years and a 46.9% decline over 5 years.
- These mixed returns sit against a backdrop where Adient and the auto sector have been under ongoing scrutiny for capital intensity, supply chain challenges and changing consumer demand, which can affect how investors think about risk. That context helps explain why some investors are rechecking whether the current share price still lines up with the fundamentals.
- On Simply Wall St's valuation checks, Adient scores 6/6. This suggests the stock screens as undervalued across all six methods we will walk through next, and we will finish by looking at one more way to make sense of that valuation story that many investors overlook.
Find out why Adient's 13.7% return over the last year is lagging behind its peers.
Approach 1: Adient Discounted Cash Flow (DCF) Analysis
A Discounted Cash Flow model takes the cash that a company is expected to generate in the future, then discounts those cash flows back to today to estimate what the business might be worth right now.
For Adient, the model uses a 2 Stage Free Cash Flow to Equity approach. The latest twelve month Free Cash Flow is about $200.4 million. Analysts have provided forecasts out to 2029, and Simply Wall St then extrapolates further, with projected Free Cash Flow of $751 million in 2030. All cash flows are modelled in $ and then discounted to today based on the risk and timing of those cash flows.
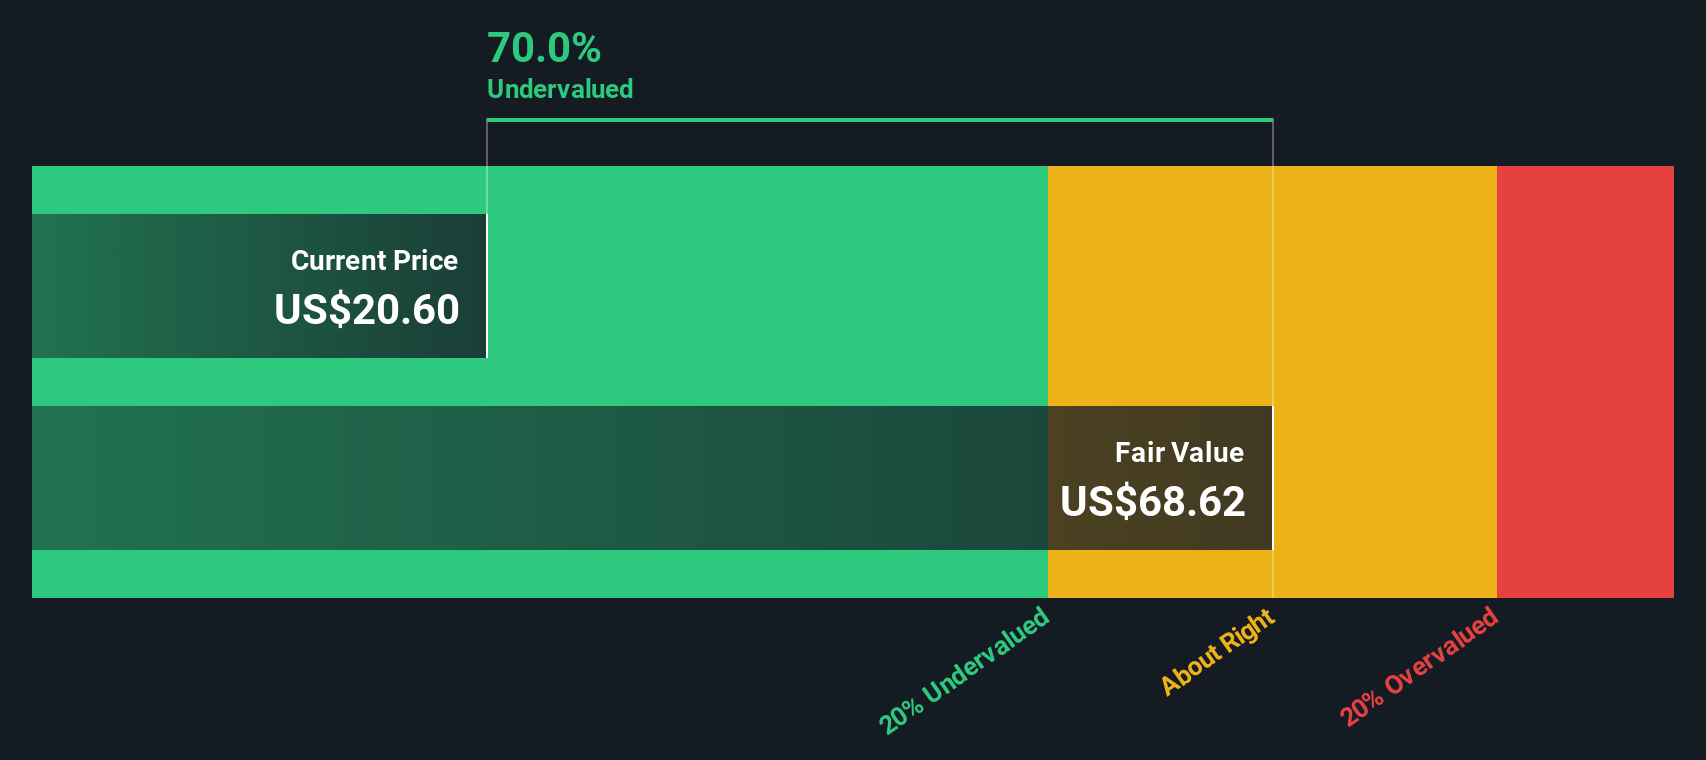
Pulling this together, the DCF model points to an estimated intrinsic value of $68.62 per share. This implies the stock trades at a 71.8% discount to this estimate. On this framework, the model suggests the shares are materially undervalued relative to the cash flows currently being priced in by the market.
Result: UNDERVALUED
Our Discounted Cash Flow (DCF) analysis suggests Adient is undervalued by 71.8%. Track this in your watchlist or portfolio, or discover 884 more undervalued stocks based on cash flows.
Approach 2: Adient Price vs Sales
For companies where earnings can be uneven, the P/S ratio is often a useful cross check because it focuses on how much investors are paying for each dollar of revenue rather than profit.
In general, investors tend to accept a higher P/S when they expect stronger growth and see lower risk, and a lower P/S when they expect slower growth or see higher risk. As a result, what looks like a “normal” multiple can vary a lot from one business to another.
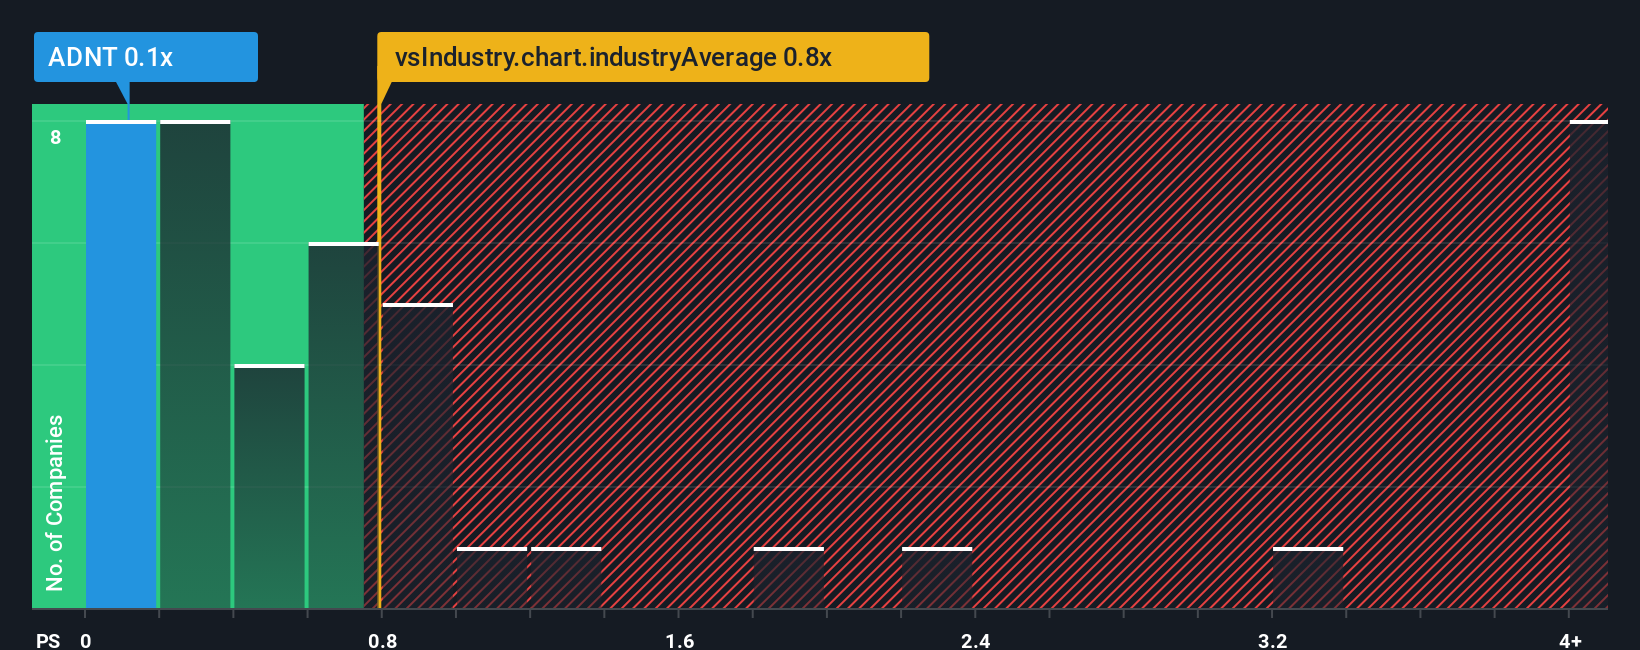
Adient currently trades on a P/S of 0.11x. That sits well below the Auto Components industry average P/S of 0.78x and the peer average of 1.35x. On a simple comparison, the stock changes hands at a lower multiple of sales than many similar companies.
Simply Wall St’s Fair Ratio for Adient is 0.32x. This is a proprietary estimate of what the P/S might be, based on factors like the company’s growth profile, profit margins, industry, market value and risk characteristics. Because it blends these elements, it aims to be more tailored than a straight comparison with industry or peer averages.
With the current P/S of 0.11x sitting below the Fair Ratio of 0.32x, this approach indicates that the shares appear undervalued on a sales basis.
Result: UNDERVALUED
P/S ratios tell one story, but what if the real opportunity lies elsewhere? Discover 1443 companies where insiders are betting big on explosive growth.
Upgrade Your Decision Making: Choose your Adient Narrative
Narratives on Simply Wall St, available on the Community page used by millions of investors, let you attach a clear story to your numbers by linking your view of Adient’s future revenue, earnings and margins to a financial forecast. You can then compare the Fair Value that comes from that forecast to the current price to help you decide whether to buy or sell. This view automatically updates when new information such as earnings or news arrives. As a result, one investor might build a Narrative that lines up with the higher US$64.00 price target, while another might lean toward the US$17.00 view, and you can quickly see which story and Fair Value feels closer to your own expectations.
Do you think there's more to the story for Adient? Head over to our Community to see what others are saying!

This article by Simply Wall St is general in nature. We provide commentary based on historical data and analyst forecasts only using an unbiased methodology and our articles are not intended to be financial advice. It does not constitute a recommendation to buy or sell any stock, and does not take account of your objectives, or your financial situation. We aim to bring you long-term focused analysis driven by fundamental data. Note that our analysis may not factor in the latest price-sensitive company announcements or qualitative material. Simply Wall St has no position in any stocks mentioned.
Have feedback on this article? Concerned about the content? Get in touch with us directly. Alternatively, email editorial-team@simplywallst.com